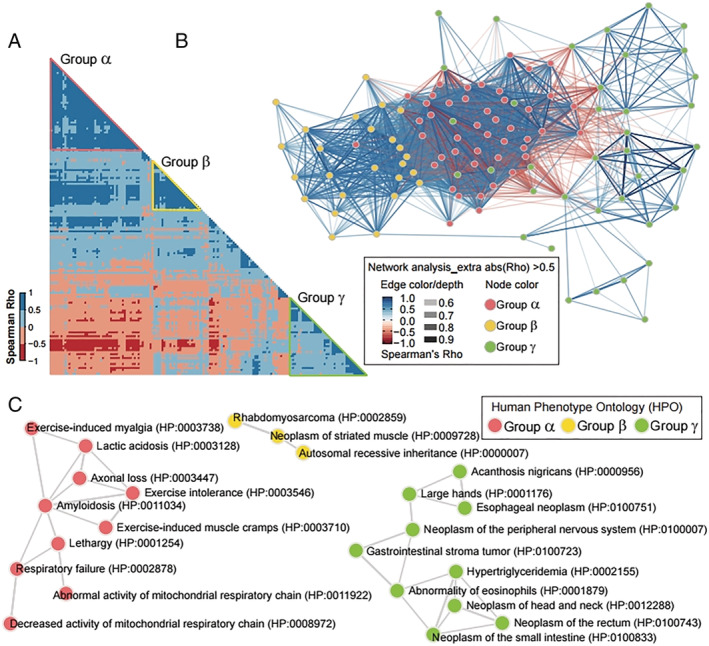
Figure 5.

Co‐expression and human phenotype ontology assay categorizing 27 artificial intelligence (AI)‐featured genes into three groups related with skeletal muscle function, metabolism and diseases. (A) Correlogram matrices display Spearman's rho of two genes facing each side of the square. The shading intensity of the correlation matrices displays Spearman's Rho as presented in the scale (left‐hand side of the correlogram). The red, yellow and green triangles on the correlogram tie group α, β and γ, respectively. (B) Gene network showing co‐expression of group α, β and γ. The Spearman's rho of two node (gene) generates the colour and depth of each edge. The colour (pink, yellow and green) of node indicates each group (group α, β and γ). The gene symbols are indicated in Figure S2. (C) Three networks generated by Enrichr showing Human Phenotype Ontology that associated with each group. The colour of nodes (HPO terms) indicates each group and the edge means sharing common genes.
