
Figure 2.
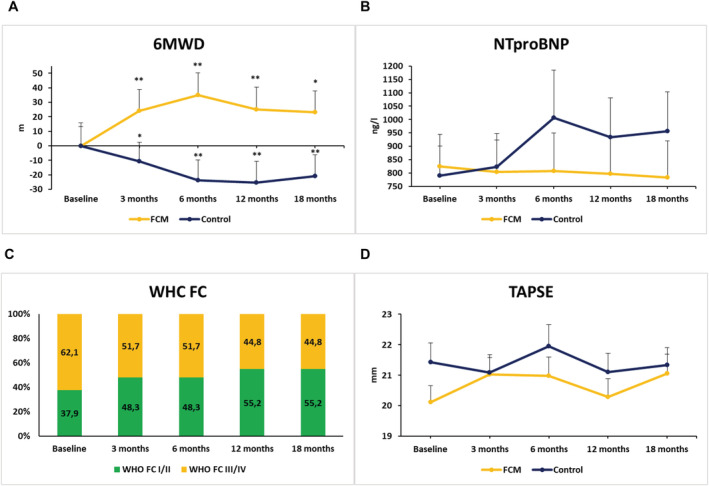
Impact of FCM on clinical, laboratory, and echocardiographic measures. Development of (A) 6 min walking distance (6MWD), (B) NTproBNP serum concentrations, (C) WHO functional class (WHO‐FC; in the FCM group), and (D) tricuspid annular plane systolic excursion (TAPSE) from baseline to 18 month follow‐up in the FCM vs. control group. Numbers represent mean values ± SEM. *P < 0.05; **P < 0.01 vs. baseline.