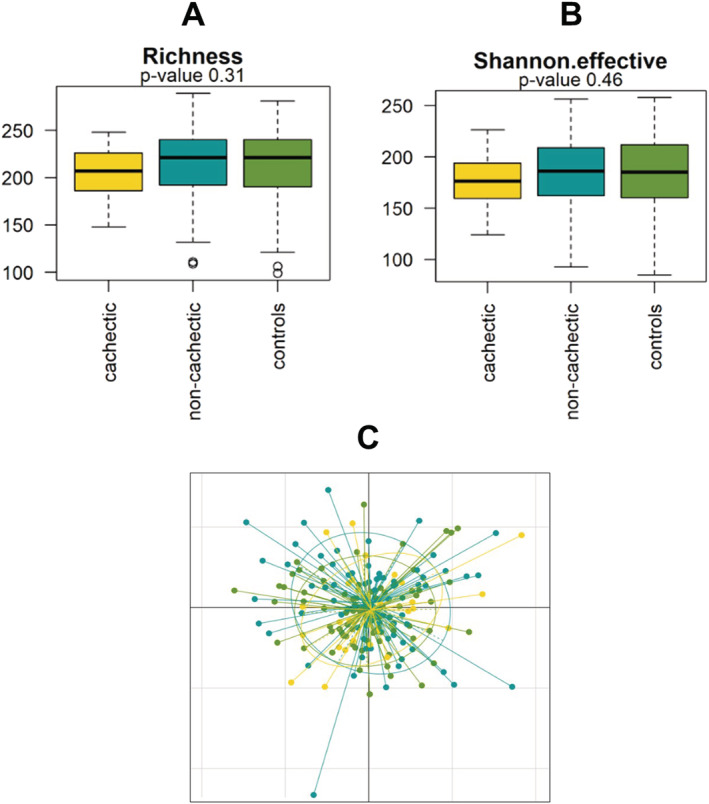
Figure 1.

Microbial richness and diversity in cachectic cancer patients (yellow, N = 33), non‐cachectic cancer patients (blue, N = 74), and healthy control subjects (green, N = 76). (A) Observed species richness and (B) Shannon effective index; both indices of α‐diversity were similar between the groups. (C) The non‐metric multidimensional scaling plot showed no clear clustering of samples from cachectic cancer patients, non‐cachectic cancer patients, or healthy controls.
