Figure 2.

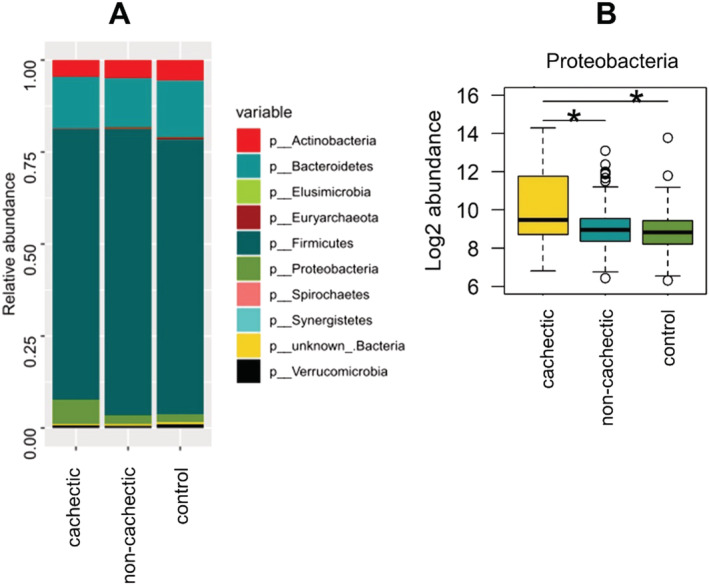
Microbiota composition on phylum level. (A) Relative abundances of all phyla present in the study population. (B) Log2 abundance of Proteobacteria. Statistically significant differences according to the Wald test (α = 0.05) are marked with asterisks. Proteobacteria were significantly elevated in cachectic cancer patients compared with non‐cachectic cancer patients and healthy controls.
