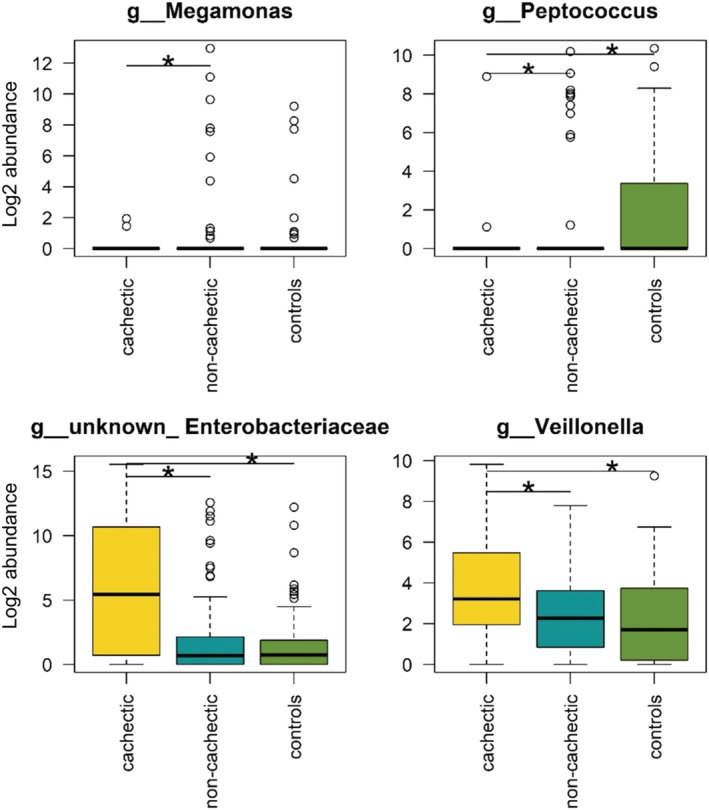
Figure 3.

Genera with altered abundance in cachectic vs. non‐cachectic cancer patients and/or healthy controls. The log2 abundance of genera, which differed significantly between the groups, is depicted. Statistically significant differences according to the Wald test (α = 0.05) are marked with asterisks.
