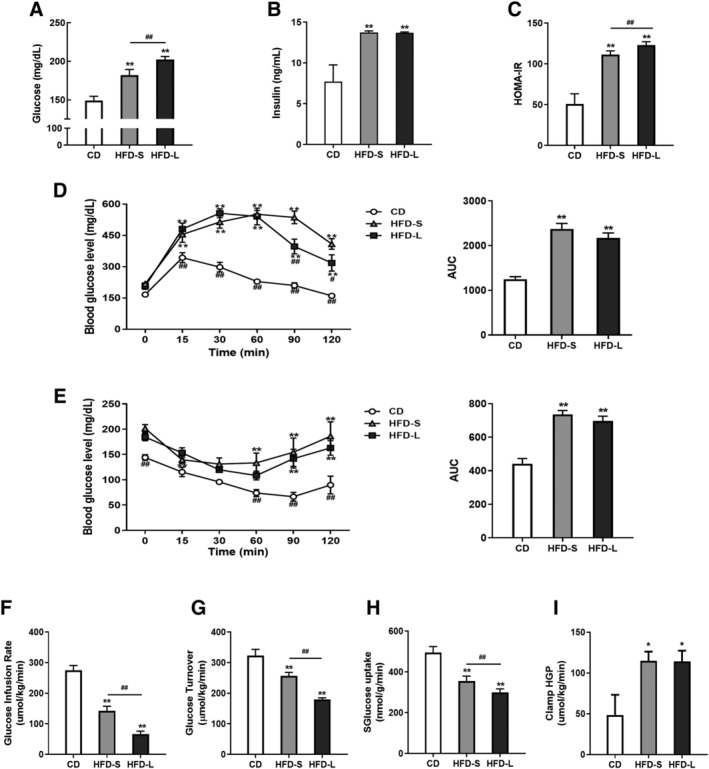
Figure 1.

Induction of insulin resistance (IR) with short‐term and long‐term high‐fat diets (HFDs) in C56BL/6 mice. Fasting glucose levels (A), plasma insulin levels (B), and HOMA‐IR (C) of control diet (CD), 2 weeks of HFD (HFD‐S)‐, and 24 weeks of HFD (HFD‐L)‐fed mice. (D) Glucose tolerance test (left) with area under curve (AUC, right). (E) Insulin sensitivity test (left) with AUC (right). (F) Glucose infusion rate and (G) glucose turnover measured by hyperinsulinaemic‐euglycaemic clamp. (H) Impaired muscle glucose uptake measured by 2‐[14C]deoxyglucose (2‐DG) uptake. (I) Hepatic glucose production (HGP) during clamp. Values expressed as means ± SEM (n = 8). *P < 0.05, **P < 0.01, significantly different from CD. Mean differences detected by one‐way ANOVA test. # P < 0.05, ## P < 0.01, significant difference between HFD‐S and HFD‐L. Mean differences detected by Student's t‐test.
