
Figure 2.
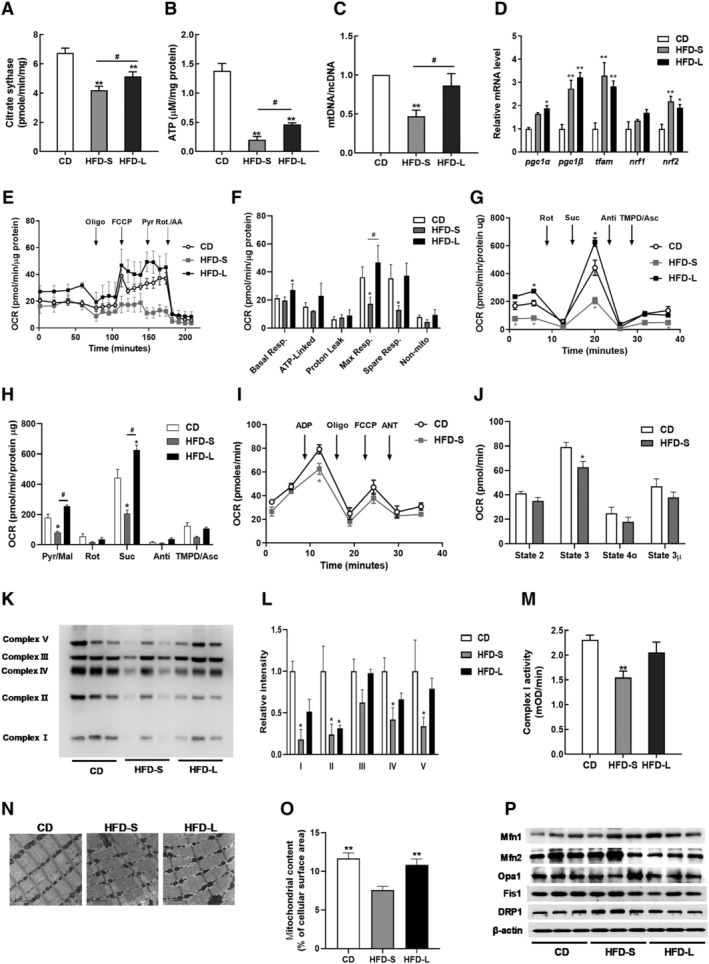
Impairment of skeletal mitochondrial function in acute IR. (A) Citrate synthase activity in gastrocnemius muscles from CD, HFD‐S, and HFD‐L groups. (B) Total ATP content in gastrocnemius muscles normalized to CD mice. (C) The mitochondrial DNA (mtDNA) content calculated as the ratio of Cox5 to Cyclophilin A DNA levels measured by quantitative PCR in gastrocnemius muscles. (D) Relative gene expressions for mitochondrial biogenesis and mtDNA replication measured by qRT‐PCR. (E) Representative oxygen consumption rate (OCR) curves, showing the response for each agent in isolated EDL myofibres. (F) Mitochondrial respiration by OCR quantification. (G) Complex‐dependent respiration determined by electron flow assay in mitochondrial proteins. (H) OCR quantification to measure complex‐dependent respiration. (I) Respiratory coupling determined by mitochondrial coupling assay. (J) OCR quantification to measure mitochondrial respiratory coupling. (K) Expression of OXPHOS Complexes in gastrocnemius muscles. (L) Quantification of OXPHOS complex expression by densitometry analysis. (M) Complex I activity in gastrocnemius muscles. (N) Representative mitochondrial morphology imaged by transmission electron microscopy (TEM). (O) Quantitative analyses of images to measure the mitochondrial surface area (n = 5). (P) Immunoblot analyses of proteins related to mitochondrial dynamics. Values expressed as means ± SEM (n = 8). *P < 0.05, **P < 0.01, significantly different from CD. Mean differences detected by ANOVA test. # P < 0.05, ## P < 0.01, significant difference between HFD‐S and HFD‐L. Mean differences detected by Student's t‐test.