Figure 3.

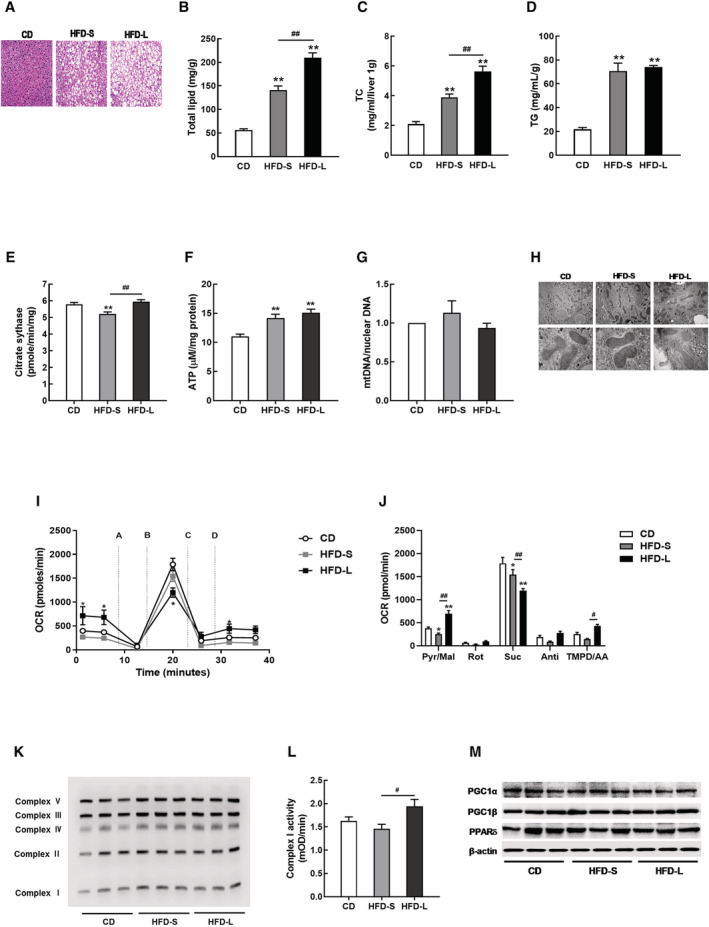
Hepatic mitochondrial dysfunction was not observed in acute IR. (A) Representative haematoxylin and eosin (H&E)‐liver sections from CD, HFD‐S, and HFD‐L mice. Hepatic lipid profiles, including total lipid content (B), total cholesterol (TC, C), and triglyceride (TG, D). (E) Citrate synthase activity in liver tissues from CD, HFD‐S, and HFD‐L groups. (F) Total ATP content in liver tissues. (G) The mitochondrial DNA (mtDNA) content calculated as the ratio of COX5 to Cyclophilin A DNA levels measured by quantitative PCR in liver tissues. (H) Mitochondrial morphology imaged by transmission electron microscopy (TEM). (I) Complex‐dependent respiration determined by electron flow assay in mitochondrial proteins. (J) OCR quantification to measure complex‐dependent respiration. (K) OXPHOS complex expression in liver tissues. (L) Complex I activity in liver tissues. (M) Expressions of PGC1 and PPARδ measured by western blot.
