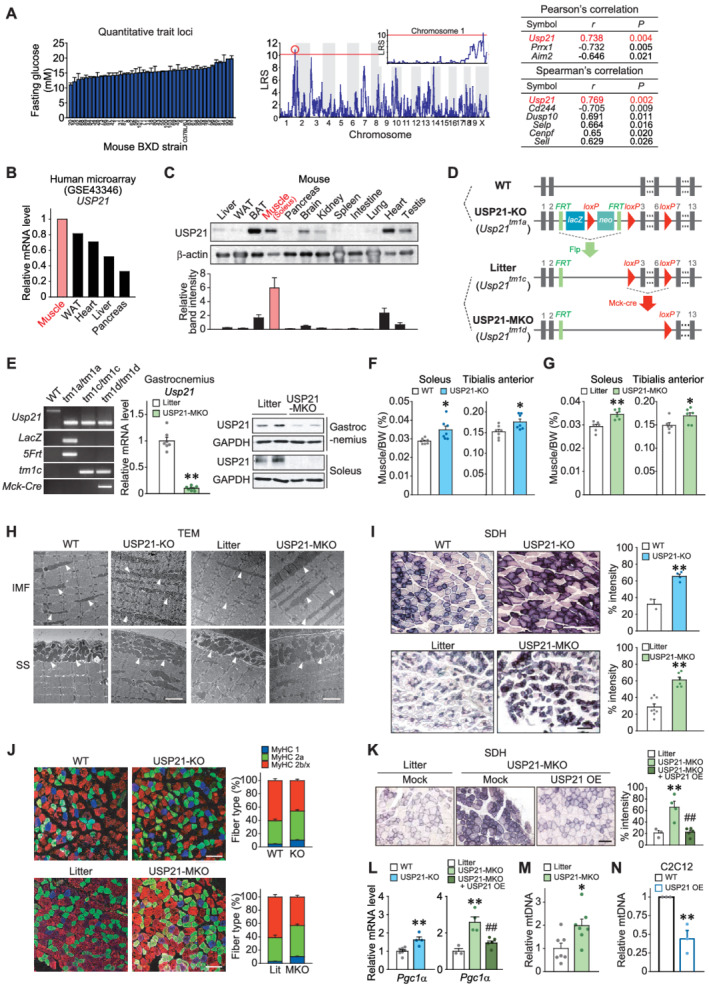
Figure 1.

Ablation of USP21 in skeletal muscle increases muscle mass and oxidative fibre type switch. (A) Quantitative trait loci analysis obtained from glucose levels in mice fasted for 4 h (BXD_12925) (left). Quantitative loci where likelihood ratio statistics (LRS) over 10 in chromosome 1 was analysed (middle). Top ranks of Pearson's and Spearman's correlation analyses are listed (right). (B) USP21 transcript levels in a microarray GEO dataset (GSE43346) available in the public domain from major human tissues indicated. (C) USP21 protein levels in different tissues. Immunoblottings were performed for a variety of tissues obtained from 18‐week‐old C57BL/6 mice fasted overnight prior to sacrifice (n = 3). A representative blot was shown. WAT, white adipose tissue; BAT, brown adipose tissue. (D) Generation of whole‐body knockout (KO) mice and skeletal muscle‐specific Usp21 knockout (MKO) mice models. Wild type (WT) and Usp21 tm1a/tm1a mice were used to assess the phenotype of systemic KO of USP21. Control littermate (Usp21 tm1c/tm1c ) mice for the skeletal muscle‐specific KO mice (Usp21 tm1d/tm1d ; MKO) were generated by breeding Usp21 tm1a/tm1a mice with protamine‐Flpe mice. Usp21 tm1c/tm1c mice were crossed with muscle creatine kinase (Mck)‐Cre mice to produce USP21‐MKO mice. (E) PCR assays for respective genotypes using genomic DNAs extracted from the tails of mice (left). qRT‐PCR assays for Usp21 in the gastrocnemius muscle of USP21‐MKO mice (middle) (n = 7, 8 each). Immunoblottings for USP21 in gastrocnemius and soleus muscle of USP21‐MKO mice (right) (n = 2 each). (F,G) Muscle weights of indicated genotypes. (F) 18‐week‐old WT or USP21‐KO mice (n = 7 each). (G) 25‐week‐old litter or USP21‐MKO mice (n = 6 each). BW, body weight. (H) Representative transmission electron micrographs (TEM) of longitudinal sections of soleus muscle. Arrows indicate intermyofibrillar (IMF) or subsarcolemmal (SS) mitochondria (n = 3 each). Scale bars: 2 μm. (I) Representative succinate dehydrogenase (SDH) activity in tibialis anterior muscle and histological quantification of staining intensity (n = 2–8 each). Scale bars: 200 μm. (J) Representative immunofluorescence images of red gastrocnemius muscle. Immunostainings were performed in 12‐week‐old WT or USP21‐KO mice, and litter or USP21‐MKO mice using specific antibodies for MyHC 1 or MyHC 2a or MyHC 2b/2x (n = 7, 7, 3, 5 each), and myofibre types of each genotype were quantified. Scale bar: 100 μm. (K) Representative SDH activity in tibialis anterior muscle and histological quantification of staining intensity (n = 3–5 each). Scale bars: 200 μm. (L) qRT‐PCR assays for peroxisome proliferator‐activated receptor gamma coactivator 1‐alpha (Pgc1α) in gastrocnemius muscle of WT or USP21‐KO mice (n = 7, 4 each), and litter or USP21‐MKO mice (n = 3–5 each). (Μ,Ν) Relative mitochondrial DNA (mtDNA) copy number in gastrocnemius muscle of litter or USP21‐MKO mice (M) (n = 7 each) and C2C12 myotubes with Usp21 overexpression (OE) or mock (N) (n = 3 each). mtDNA copy number represents the ratio of mtDNA to nuclear DNA measured by qRT‐PCR. Values are expressed as means ± standard error of the mean (SEM). *P < 0.05, **P < 0.01, by Student's t test (E–G,I,L–N). **P < 0.01 for WT vs. USP21‐MKO mice; ##P < 0.01 for USP21‐MKO vs. USP21‐MKO mice plus USP21 overexpression by one‐way ANOVA with Tukey's multiple comparisons correction (K,L).
