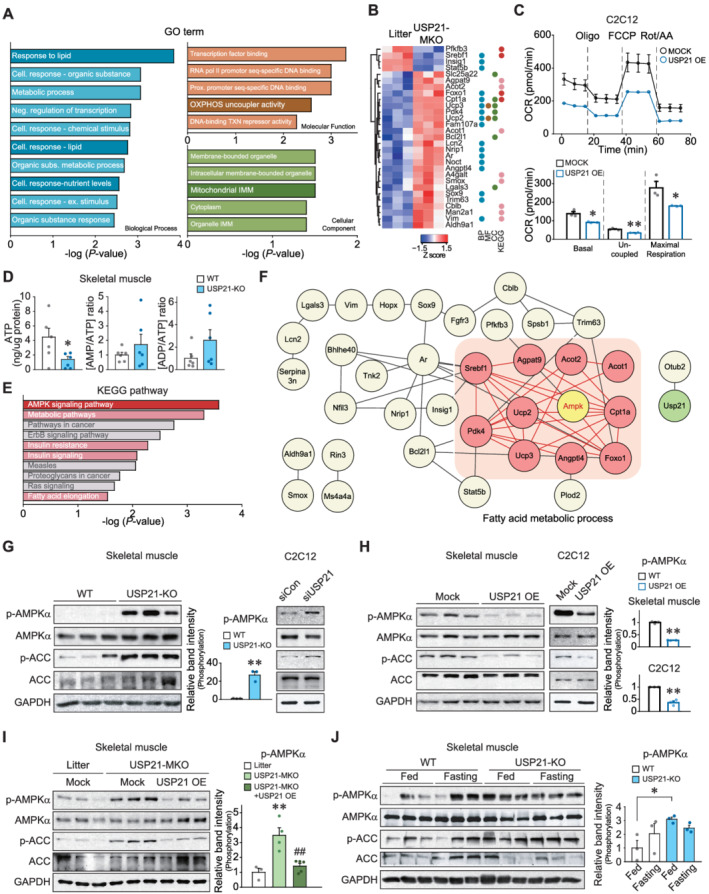
Figure 3.

USP21 ablation induces AMPK activation. (A,B) RNA‐seq analyses using gastrocnemius muscle of 12‐week‐old WT and USP21‐MKO mice (n = 3 each). Significantly up‐regulated or down‐regulated genes by skeletal muscle‐specific Usp21 deletion. (A) Results of gene ontology (GO) terms. GO terms enrichment were analysed using g:Profiler. GO terms relevant to mitochondrial homeostasis were presented as dark coloured bar graph. (B) Hierarchically clustered differentially expressed genes (DEGs) were presented as heatmaps according to the Z score (blue, underexpression; red, overexpression). The DEGs corresponding to GO terms and Kyoto Encyclopedia of Genes and Genomes (KEGG) pathways were marked as the same coloured circles with relevant bar graphs. BP, biological process; CC, cellular component; MF, molecular function; Cell, cellular; Neg, negative; Subs, substances; Ex, external; Prox, proximal, OXPHOS, oxidative phosphorylation; TXN, transcription; and IMM, inner membrane. (C) Respiration assays using an XFp Extracellular Flux Analyzer. The oxygen consumption rate (OCR) in C2C12 myotubes with USP21 overexpression (or mock). Real‐time triplicate readings (upper) and mitochondrial respiration rates of basal, uncoupled, maximal respiration (lower) are shown (three points each). The data were normalized to the cell numbers. Oligo, oligomycin; FCCP, carbonyl cyanide‐4‐(trifluoromethoxy)phenylhydrazone; Rot, rotenone; and AA, antimycin A. (D) Adenosine triphosphate (ATP) concentrations, AMP/ATP, and ADP/ATP ratios in tibialis anterior muscle of WT and USP21‐KO mice (n = 6 each). (E) KEGG pathway analysis using KEGG pathway database derived from RNA‐seq as in Panel (A). Energy metabolism related pathways are marked as red and pink bar graphs. (F) Core network analysis associated with the AMPK pathway derived from RNA‐seq dataset as in Panel (A). AMPK‐associated neighbour genes, whose expression was assigned to FA metabolic process and affected by USP21‐MKO, are shown as pink coloured circles. The network was analysed using STRING, Cytoscape plugin Genemania, and Cluster ONE. (G–J) Immunoblottings for phosphorylated‐AMPKα and phosphorylated‐ACC in skeletal muscle or C2C12 myotubes. (G) Gastrocnemius muscle of 13‐week‐old WT or USP21‐KO mice (n = 3 each, left) and C2C12 myotubes transfected with Usp21‐specific siRNA (or mock) (right). The cell‐based data were confirmed in a separate experiment. (H) Tibialis anterior muscle of 12‐week‐old WT mice 7 days after electroporation‐mediated USP21 gene delivery (or mock) (n = 3 each, left). C2C12 cells were differentiated to myotubes after transfection with USP21 or mock for 24 h (n = 3 each, right). (I) Tibialis anterior muscle 7 days after electroporation‐mediated gene delivery. Each mouse of the indicated genotype received a control vector in one limb, and USP21‐MKO mice received a plasmid expressing USP21 in the contralateral limb (n = 3–5 each). (J) Soleus muscle from mice fed ad libitum or fasted for 24 h (n = 3 each). Values are expressed as means ± standard error of the mean (SEM). *P < 0.05, **P < 0.01, by Student's t‐test (C,D,G,H,J). **P < 0.01 for WT vs. USP21‐MKO mice; ##P < 0.01 for USP21‐MKO vs. USP21‐MKO mice plus USP21 overexpression by one‐way ANOVA with Tukey's multiple comparisons correction ANOVA (I).
