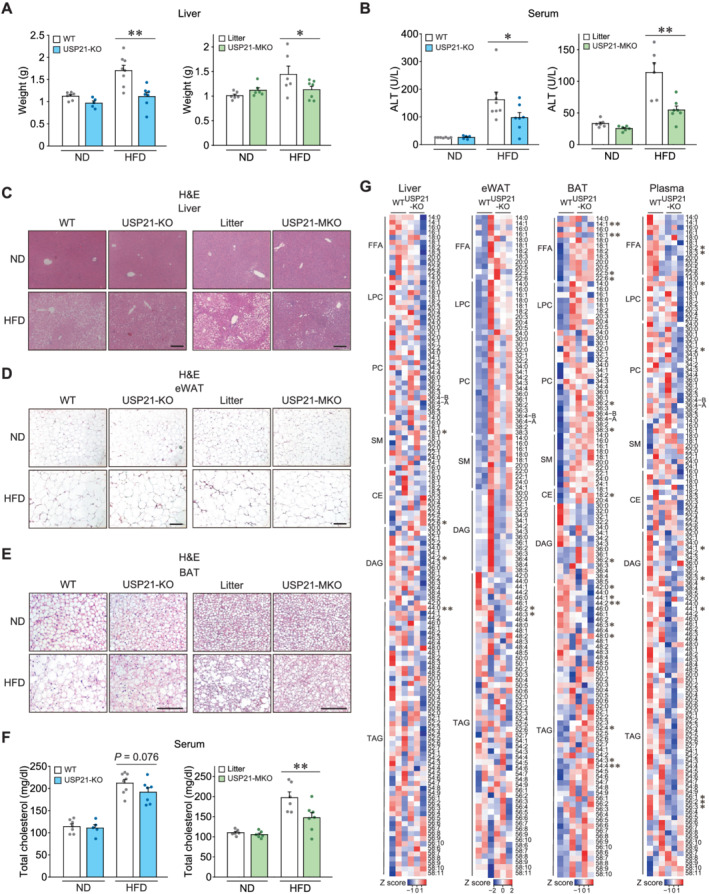
Figure 6.

Loss of USP21 protects other metabolic organs from diet‐induced obesity. (A–F) WT or USP21‐KO mice (n = 5–8 each); or litter or USP21‐MKO mice (n = 6–7 each) were fed an ND or an HFD for 11 weeks. (A) Liver weights. (B) Serum ALT activities. (C–E) Haematoxylin and eosin (H&E)‐stained images of liver (C), epididymal fat (D), and BAT (E) of indicated genotypes. Scale bar: 200 μm. (F) Serum cholesterol contents. ALT, alanine transaminase. (G) Heatmaps for lipids profiling in the indicated tissues and plasma of 12‐week‐old WT and USP21‐KO mice as assessed by liquid chromatography–mass spectrometry/mass spectrometry (LC–MS/MS) (n = 3 each). The first number of analyte indicates the number of carbons in the lipid acyl chain and the number after the colon indicates the number of double bonds in the lipid acyl chain(s). Lipids peak intensities with independent Student's t test (*P < 0.05, **P < 0.01) were presented as heatmaps according to the Z score. Values are expressed as means ± standard error of the mean (SEM). *P < 0.05, **P < 0.01, by one‐way ANOVA with least significant difference multiple comparisons correction (A,B,F).
