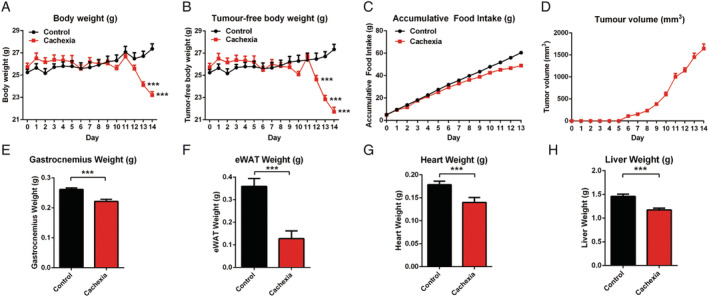
Figure 1.

Cachexia symptoms of cancer cachexia model mice (C26 tumour‐bearing mice). (A) Body weight of cancer cachexia mice and healthy control mice. (B) Tumour‐free body weight of cancer cachexia mice and healthy control mice. (C) Accumulative food intake of cancer cachexia mice and healthy control mice. (D) Tumour growth curve of C26 tumour‐bearing mice. (E) GA muscle tissue weight of cancer cachexia mice and healthy control mice. (F) eWAT fat tissue weight of cancer cachexia mice and healthy control mice. (G) Heart weight of cancer cachexia mice and healthy control mice. (H) Liver weight of cancer cachexia mice and healthy control mice. Data presented are the mean ± SEM of results of 8 mice in each group. T‐test analysis was performed to assess the significance of the difference. *P < 0.05; **P < 0.01, ***P < 0.001 between the indicated two groups.
