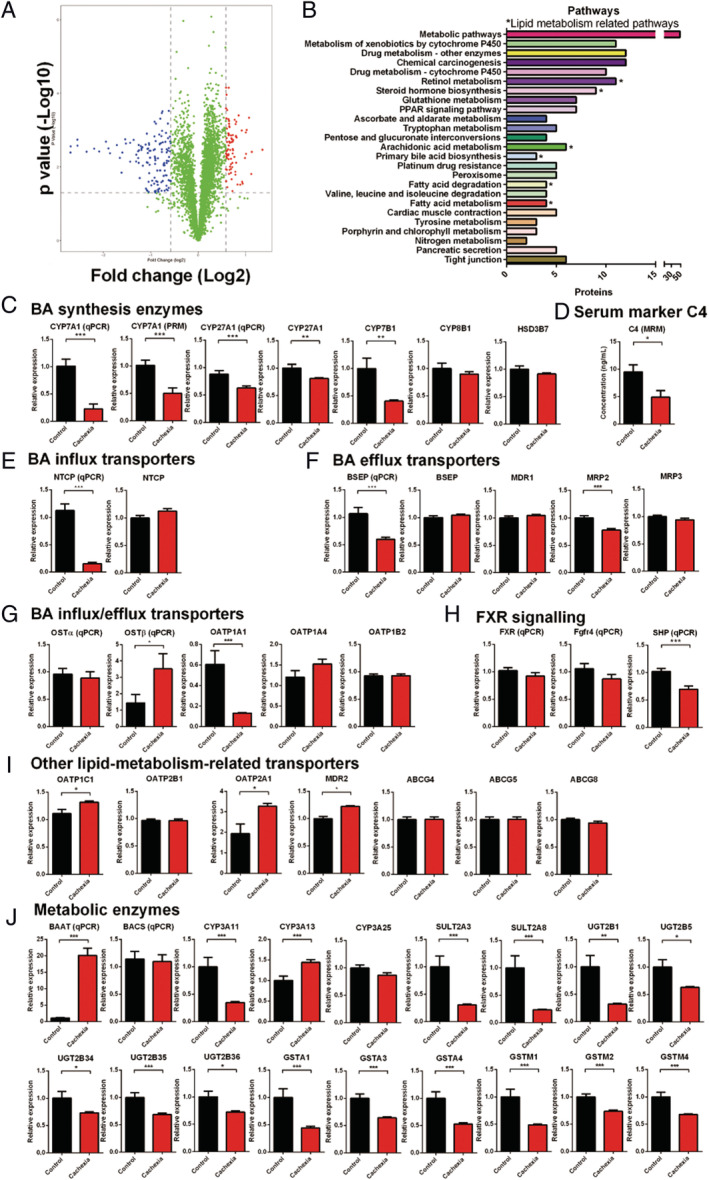
Figure 3.

Results of liver proteomic analysis. (A) Volcano graph of the results of comparing protein expression profiles of cancer cachexia mice liver and healthy control mice liver. (B) Results of Kyoto Encyclopedia of Genes and Genomes enrichment analysis based on the down‐regulated proteins in the cancer cachexia group. *Lipid metabolism‐related pathways. (C) The expression levels of key enzymes involved in BA synthesis. (D) The expression level of C4 which is BA synthesis marker in serum. (E) The expression levels of BA influx transporters. (F) The expression levels of BA efflux transporters. (G) The expression levels of BA influx/efflux transporters. (H) The expression levels of genes involved in FXR signalling. (I) The expression levels of other key transporters involved in lipid metabolism. (J) The expression levels of BA metabolic enzymes. Data presented are the mean ± SEM of results of eight mice in each group. T‐test analysis was performed to assess the significance of the difference. *P < 0.05; **P < 0.01, ***P < 0.001. BA, bile acid.
