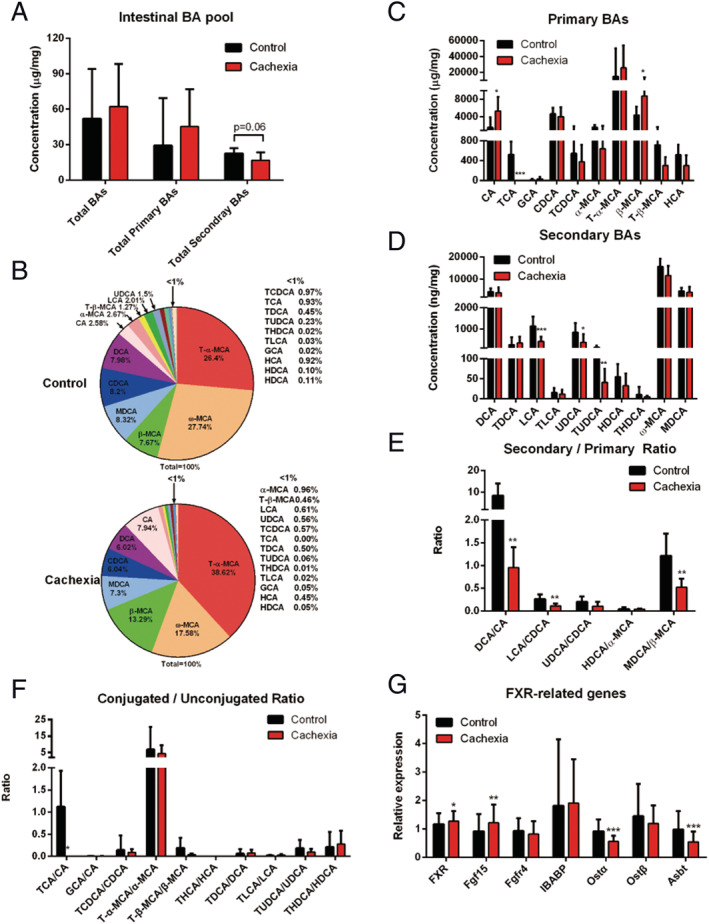
Figure 4.

Intestinal BA profiles in cancer cachexia model mice and healthy control mice. (A) The amount of total BAs, total primary BAs and total secondary BAs in the caecum of cancer cachexia model mice and healthy control mice. (B) Pie graphs are the mean percentage of the individual bile acids in total BAs. (C) Bar graphs are the concentrations of the primary bile acids in caecum. (D) Bar graphs are the concentrations of the secondary bile acids in caecum. (E) Bar graphs are the ratios of the primary/secondary bile acids in caecum. (F) Bar graphs are the ratios of the conjugated/unconjugated bile acids in caecum. (G) The expression levels of FXR‐related genes in caecum. Data presented are the mean ± SEM of results of eight mice in each group. T‐test analysis was performed to assess the significance of the difference. *P < 0.05; **P < 0.01, ***P < 0.001. BA, bile acid; FXR, farnesoid X receptor.
