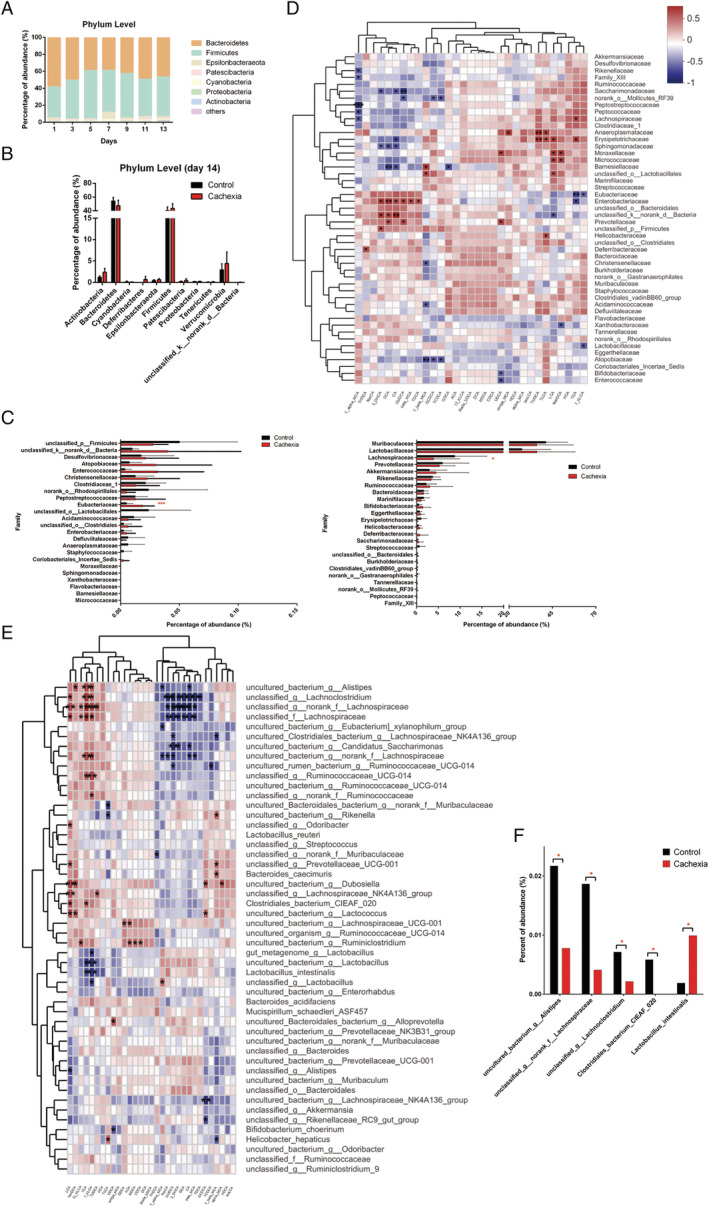
Figure 5.

Gut microbiota profiles at the different levels. (A) Time‐related change in the intestinal microbiota profile at phylum level in cachexia mice. (B) Relative abundances of the 11 phylum of intestinal microbiota at Day 14 after tumour inoculation in cachexia mice compared with that of healthy control mice. (C) Relative abundances of the major family of intestinal microbiota in cachexia mice compared with that of healthy control mice. (D) Heatmap of correlation between the intestinal microbial abundance (at family level) and the intestinal levels of BAs. (E) Heatmap of correlation between the intestinal microbial abundance (at species level) and the intestinal levels of BAs. (F) Relative abundances of the major species of cachexia intestinal microbiota were listed. Data presented are the mean ± SEM of results of eight mice in each group. T‐test analysis was performed to assess the significance of the difference. *P < 0.05; **P < 0.01, ***P < 0.001. BA, bile acid.
