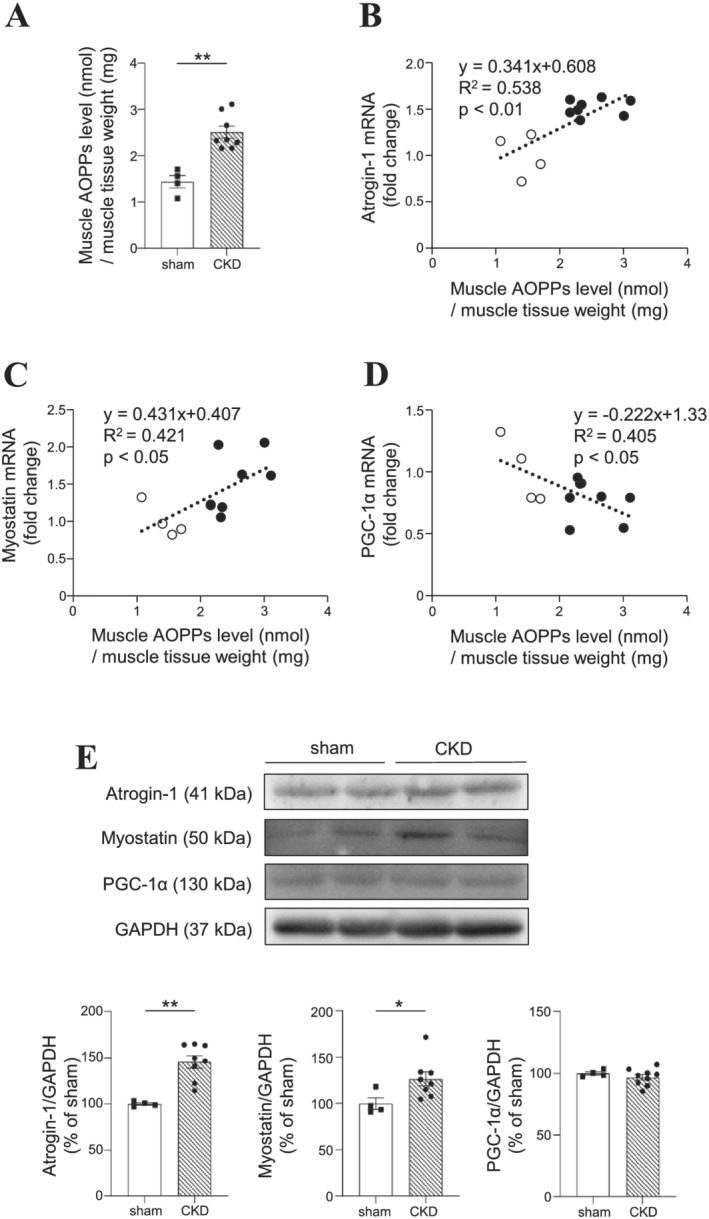
Figure 2.

Relationship between muscle advanced oxidation protein products (AOPPs) levels and the expression of muscle atrophy‐related genes in 5/6‐nephrectomized chronic kidney disease (CKD) mice. (A) AOPPs levels in muscle and (B–D) the expression of muscle atrophy‐related genes in the gastrocnemius were measured at 8 weeks after 5/6‐nephrectomized. Relationship between muscle AOPPs levels and the mRNA expression of (B) atrogin‐1 (R 2 = 0.538, P < 0.01), (C) myostatin (R 2 = 0.421, P < 0.05), and (D) PGC‐1α (R 2 = 0.405, P < 0.05) in the gastrocnemius. The fold changes as compared with the average data from patients without sarcopenia were shown. (E) Western blot analyses of atrogin‐1, myostatin and PGC‐1α in the gastrocnemius of sham and CKD mice. Data are expressed the mean ± SEM (n = 4–8). **P < 0.01 compared with sham.
