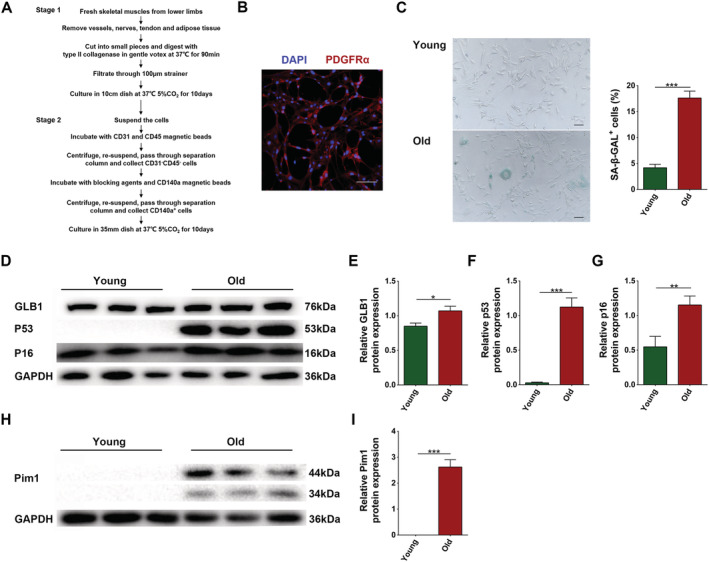
Figure 5.

Separation of PDGFRα+ mesenchymal progenitors and establishment of aging model. (A) Separation of PDGFRα+ mesenchymal progenitors by magnetic beads. (B) Immunofluorescent staining of PDGFRα (scale = 100 μm). (C) Senescence associated β‐galactosidase staining and content of SA‐β‐GAL+ cells (%) (scale = 100 μm). (D) Detection of GLB1, p53, and p16 expression through western blotting; GAPDH: internal reference. (E–G) Relative protein‐expression levels of GLB1, p53, and p16. (H) Detection of Pim1 expression through western blotting; GAPDH: internal reference. (I) Relative protein‐expression level of Pim1. N = 3; *P < 0.05, **P < 0.01, ***P < 0.001.
