
Figure 2.
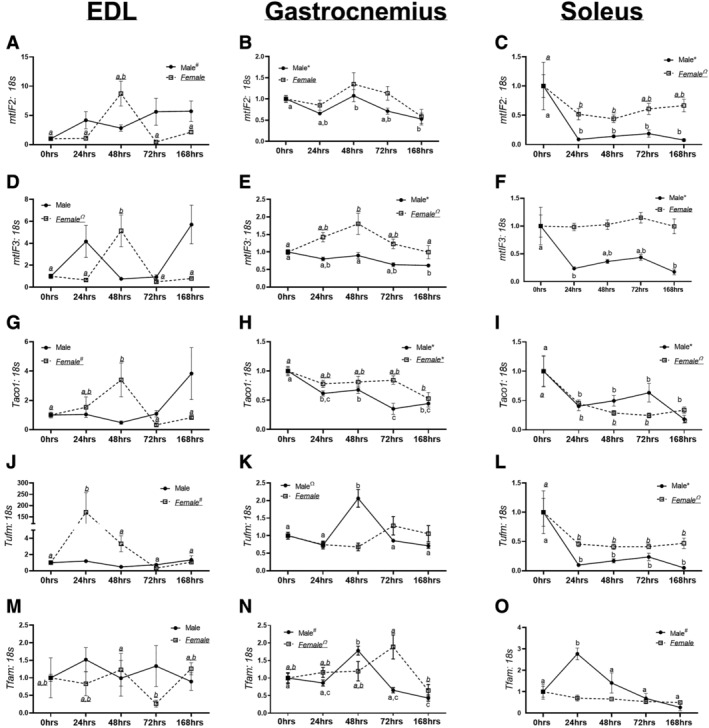
mRNA content of markers of mitochondrial translation. (A) mtiF2 mRNA content in extensor digitorum longus (EDL) muscle in male and female mice. (B) mtiF2 mRNA content in gastrocnemius muscle in male and female mice. (C) mtiF2 mRNA content in the soleus muscle in male and female mice. (D) mtiF3 mRNA content in EDL muscle in male and female mice. (E) mtiF3 mRNA content in the gastrocnemius muscle in male and female mice. (F) mtiF3 mRNA content in the soleus muscle in male and female mice. (G) Taco1 mRNA content in the EDL muscle in male and female mice. (H) Taco1 mRNA content in the gastrocnemius muscle in male and female mice. (I) Taco1 mRNA content in the soleus muscle in male and female mice. (J) Tufm mRNA content in the EDL muscle in male and female mice. (K) Tufm mRNA content in the gastrocnemius muscle in male and female mice. (L) Tufm mRNA content in the soleus muscle in male and female mice. (M) Tfam mRNA content in the EDL muscle in male and female mice. (N) Tfam mRNA content in the gastrocnemius muscle in male and female mice. (O) Tfam mRNA content in the soleus muscle in male and female mice. Different letters indicate statistical differences within a sex at P < 0.05. * indicates linear trend, Ω indicates quadratic trend, and # indicates cubic trend within as sex.