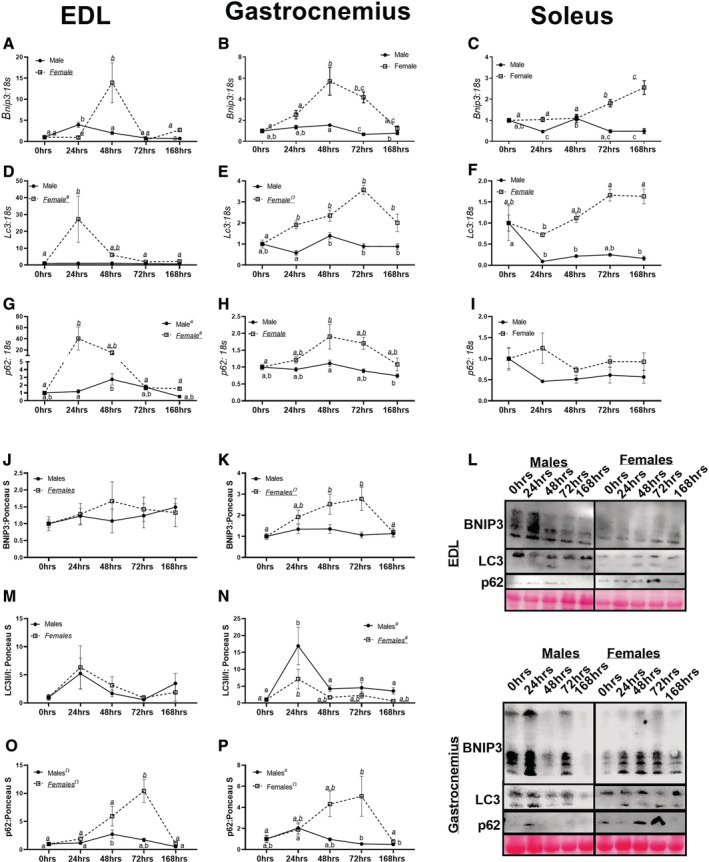
Figure 5.

mRNA and protein content of markers of mitophagy and autophagy. (A) Bnip3 mRNA content in the extensor digitorum longus (EDL) muscle in male and female mice. (B) Bnip3 mRNA content in the gastrocnemius muscle in male and female mice. (C) Bnip3 mRNA content in the soleus muscle in male and female mice. (D) Lc3 mRNA content in the EDL muscle in male and female mice. (E) Lc3 mRNA content in the gastrocnemius muscle in male and female mice. (F) Lc3 mRNA content in the soleus muscle in male and female mice. (G) p62 mRNA content in the EDL muscle in male and female mice. (H) p62 mRNA content in the gastrocnemius muscle in male and female mice. (I) p62 mRNA content in the soleus muscle in male and female mice. (J) BNIP3 protein content in the EDL muscle in male and female mice. (K) BNIP3 protein content in the gastrocnemius muscle in male and female mice. (L) Representative images of Western Blot images for EDL and gastrocnemius muscles. (M) LC3II/I protein content in the EDL muscle in male and female mice. (N) LC3II/I protein content in the gastrocnemius muscle in male and female mice. (O) p62 protein content in the EDL muscle in male and female mice. (P) p62 protein content in the gastrocnemius muscle in male and female mice. Different letters indicate statistical differences within a sex at P < 0.05. * indicates linear trend, Ω indicates quadratic trend, and # indicates cubic trend within as sex.
