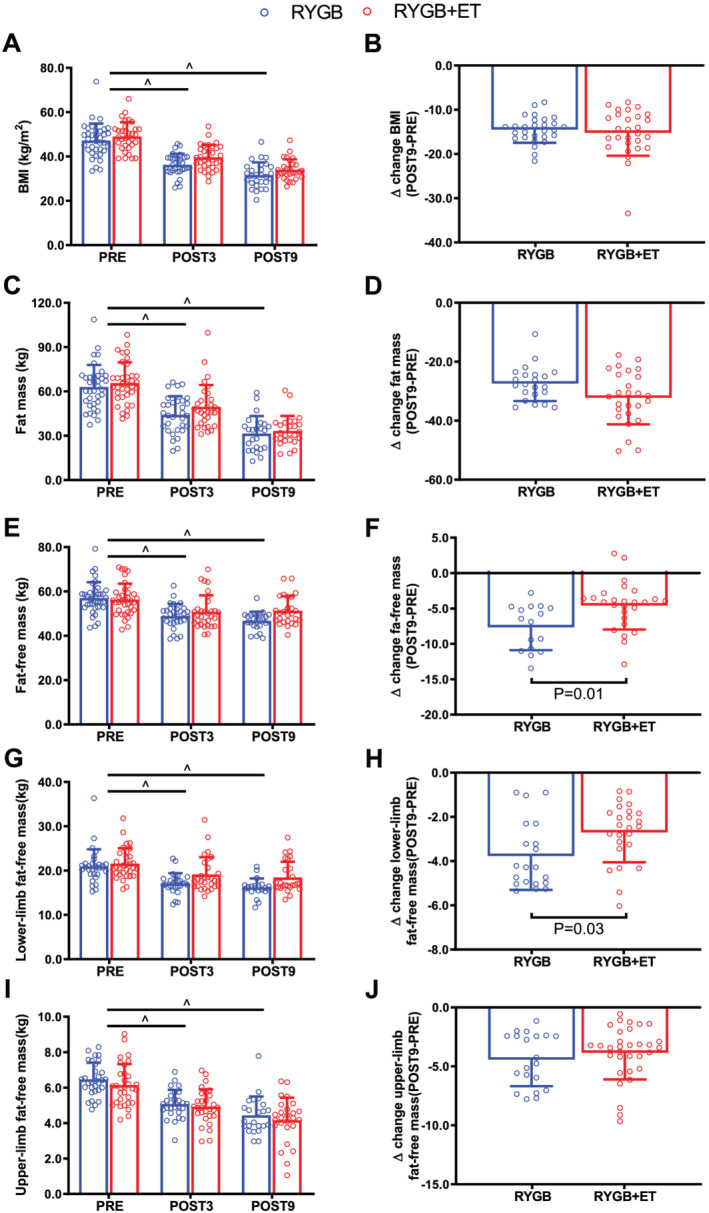
Figure 1.

Changes in body composition. RYGB + ET (n = 28): Roux‐en‐Y gastric bypass plus exercise training group; RYGB (n = 27): Roux‐en‐Y gastric bypass plus non‐exercise. Body mass index (BMI), fat mass, fat‐free mass, and lower‐ and upper‐limb fat‐free mass in the experimental groups (Panels A, C, E, G, and I, respectively). Absolute changes (∆) from POST9 to PRE for BMI, fat mass, fat‐free mass, lower‐limb fat‐free mass (Panels B, D, F, H, and J, respectively). Data are expressed as mean ± SD. PRE, before surgery (baseline); POST3, 3 months following surgery; POST9, 9 months following surgery. ^ indicates P < 0.05 for main effect of time.
