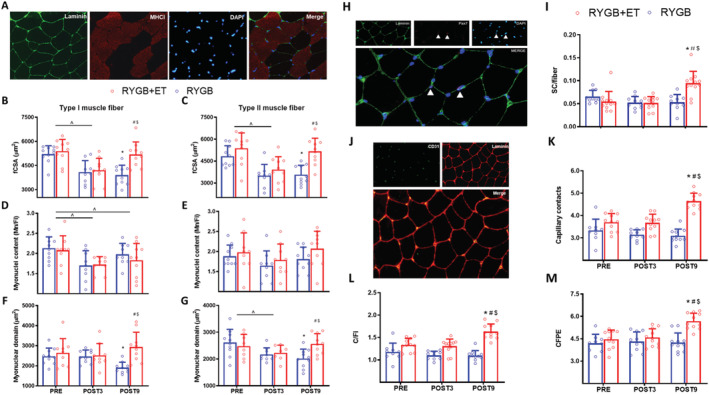
Figure 3.

Muscle fibre cross‐sectional area, myonuclei content, myonuclear domain, muscle fibre capillarization, and satellite cell content. RYGB + ET (n = 11): Roux‐en‐Y gastric bypass plus exercise training group; RYGB (n = 11): Roux‐en‐Y gastric bypass plus non‐exercise. A representative image of the immunofluorescence staining for analysis of Types I and II muscle fibre cross‐sectional area (fCSA), myonuclei content, myonuclear domain (Panel A), satellite cells content (Panel H), and capillarization (Panel J). Types I and II muscle fibre cross‐sectional area (fCSA) (Panels B and C, respectively), myonuclei content (Panels D and E, respectively), myonuclear domain (Panels F and G, respectively), satellite cells content (Panel I), capillary contacts (CC) (Panel K), capillary‐to‐fibre ratio on an individual fibre basis (C/Fi) (Panel L), and capillary‐to‐fibre perimeter exchange index (CFPE) (Panel M). Data are expressed as mean ± SD. PRE: before surgery (baseline); POST3: 3 months following surgery; POST9: 9 months following surgery. ^ indicates P < 0.05 for main effect of time; * indicates P < 0.05 in comparison with PRE; # indicates P < 0.05 in comparison with POST3; $ indicates P < 0.05 for between‐group comparison with POST9.
