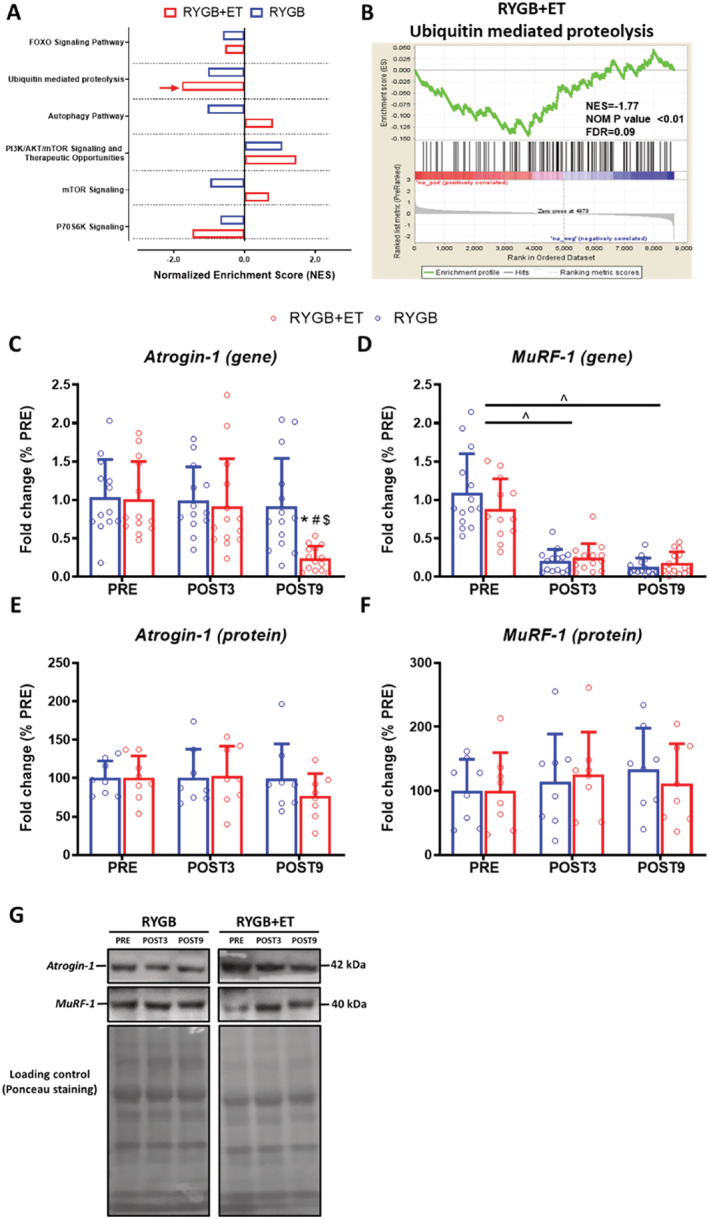
Figure 4.

Pathway enrichment analysis related to muscle plasticity, gene and protein expression of atrogin‐1 and MuRF‐1. RYGB+ET [n = 14(8 for western blot)]: Roux‐en‐Y gastric bypass plus exercise training group; RYGB [n = 14 (8 for western blot)]: Roux‐en‐Y gastric bypass plus non‐exercise. Gene set enrichment analysis (GSEA) related to muscle protein synthesis and breakdown (Panel A) and the GSEA‐plot of the ubiquitin mediated proteolysis pathway (Panel B). Gene and protein expression for Atrogin‐1 (Panels C and E, respectively) and MuRF‐1 (Panels D and F, respectively). Representative image of the Western blot bands for Atrogin‐1 and MuRF‐1 (Panel H). Data are expressed as mean ± SD. Red arrow indicates an enrichment with a false discovery rate (FDR) ≤ 10% and the absolute log2 fold‐change >1.5; PRE: before surgery (baseline); POST3: 3 months following surgery; POST9: 9 months following surgery. ^ indicates P < 0.05 for main effect of time; * indicates P < 0.05 in comparison to PRE; # indicates P < 0.05 in comparison to POST3; $ indicates P < 0.05 for between‐group comparison at POST9.
