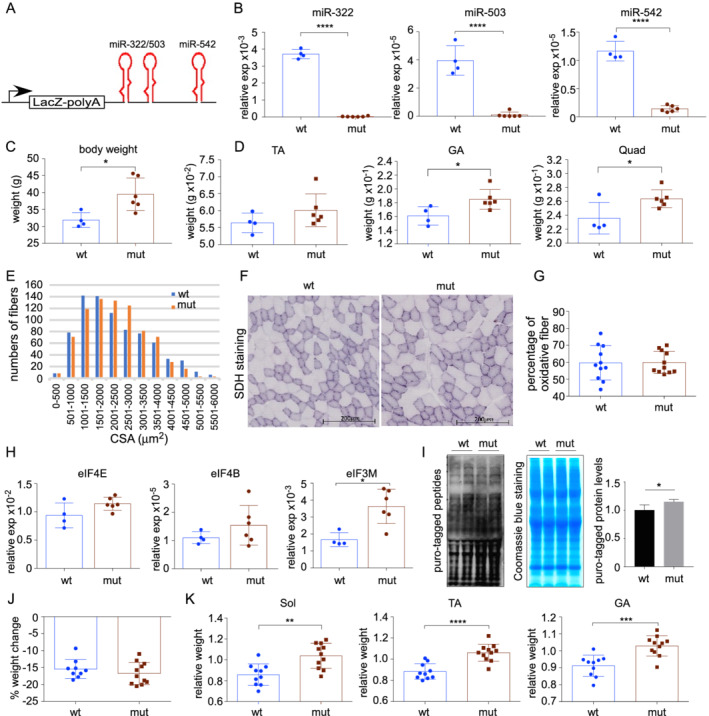
Figure 5.

Inactivation of the H19X locus promoted muscle growth and rendered resistance to starvation‐induced atrophy. (A) Diagram of the insertion mutation that blocks downstream transcription in the H19X locus. (B) Quantification of miR‐322, miR‐503, and miR‐542 expression in mutant vs. control muscles (n = 4 vs. 6). (C) Mutant animals had higher body weights than control animals at 6 months old (n = 4 vs. 6). (D) Hindlimb muscle masses were higher in mutant animals than in control animals (n = 4 vs. 6). (E) Frequency histograms of CSA in mutant vs. control muscles (n = 5 vs. 5). (F) Representative images of SDH staining. (G) Percentage of oxidative fibres as determined by SDH staining (n = 11 vs. 11). (H) Quantification of eIF4E, eIF4B, and eIF3M expression in mutant vs. control muscles (n = 4 vs. 6). (I) New protein synthesis was up‐regulated in mutant muscles. (J) Body weight loss was comparable in mutant and control animals after 48 h starvation (n = 9 vs. 11). (K) Interruption of the H19X locus partially rescued starvation‐induced muscle wasting (n = 10 vs. 11). Shown are muscle weight/body weight ratios of starved animals normalized to that of regularly fed control littermates.
