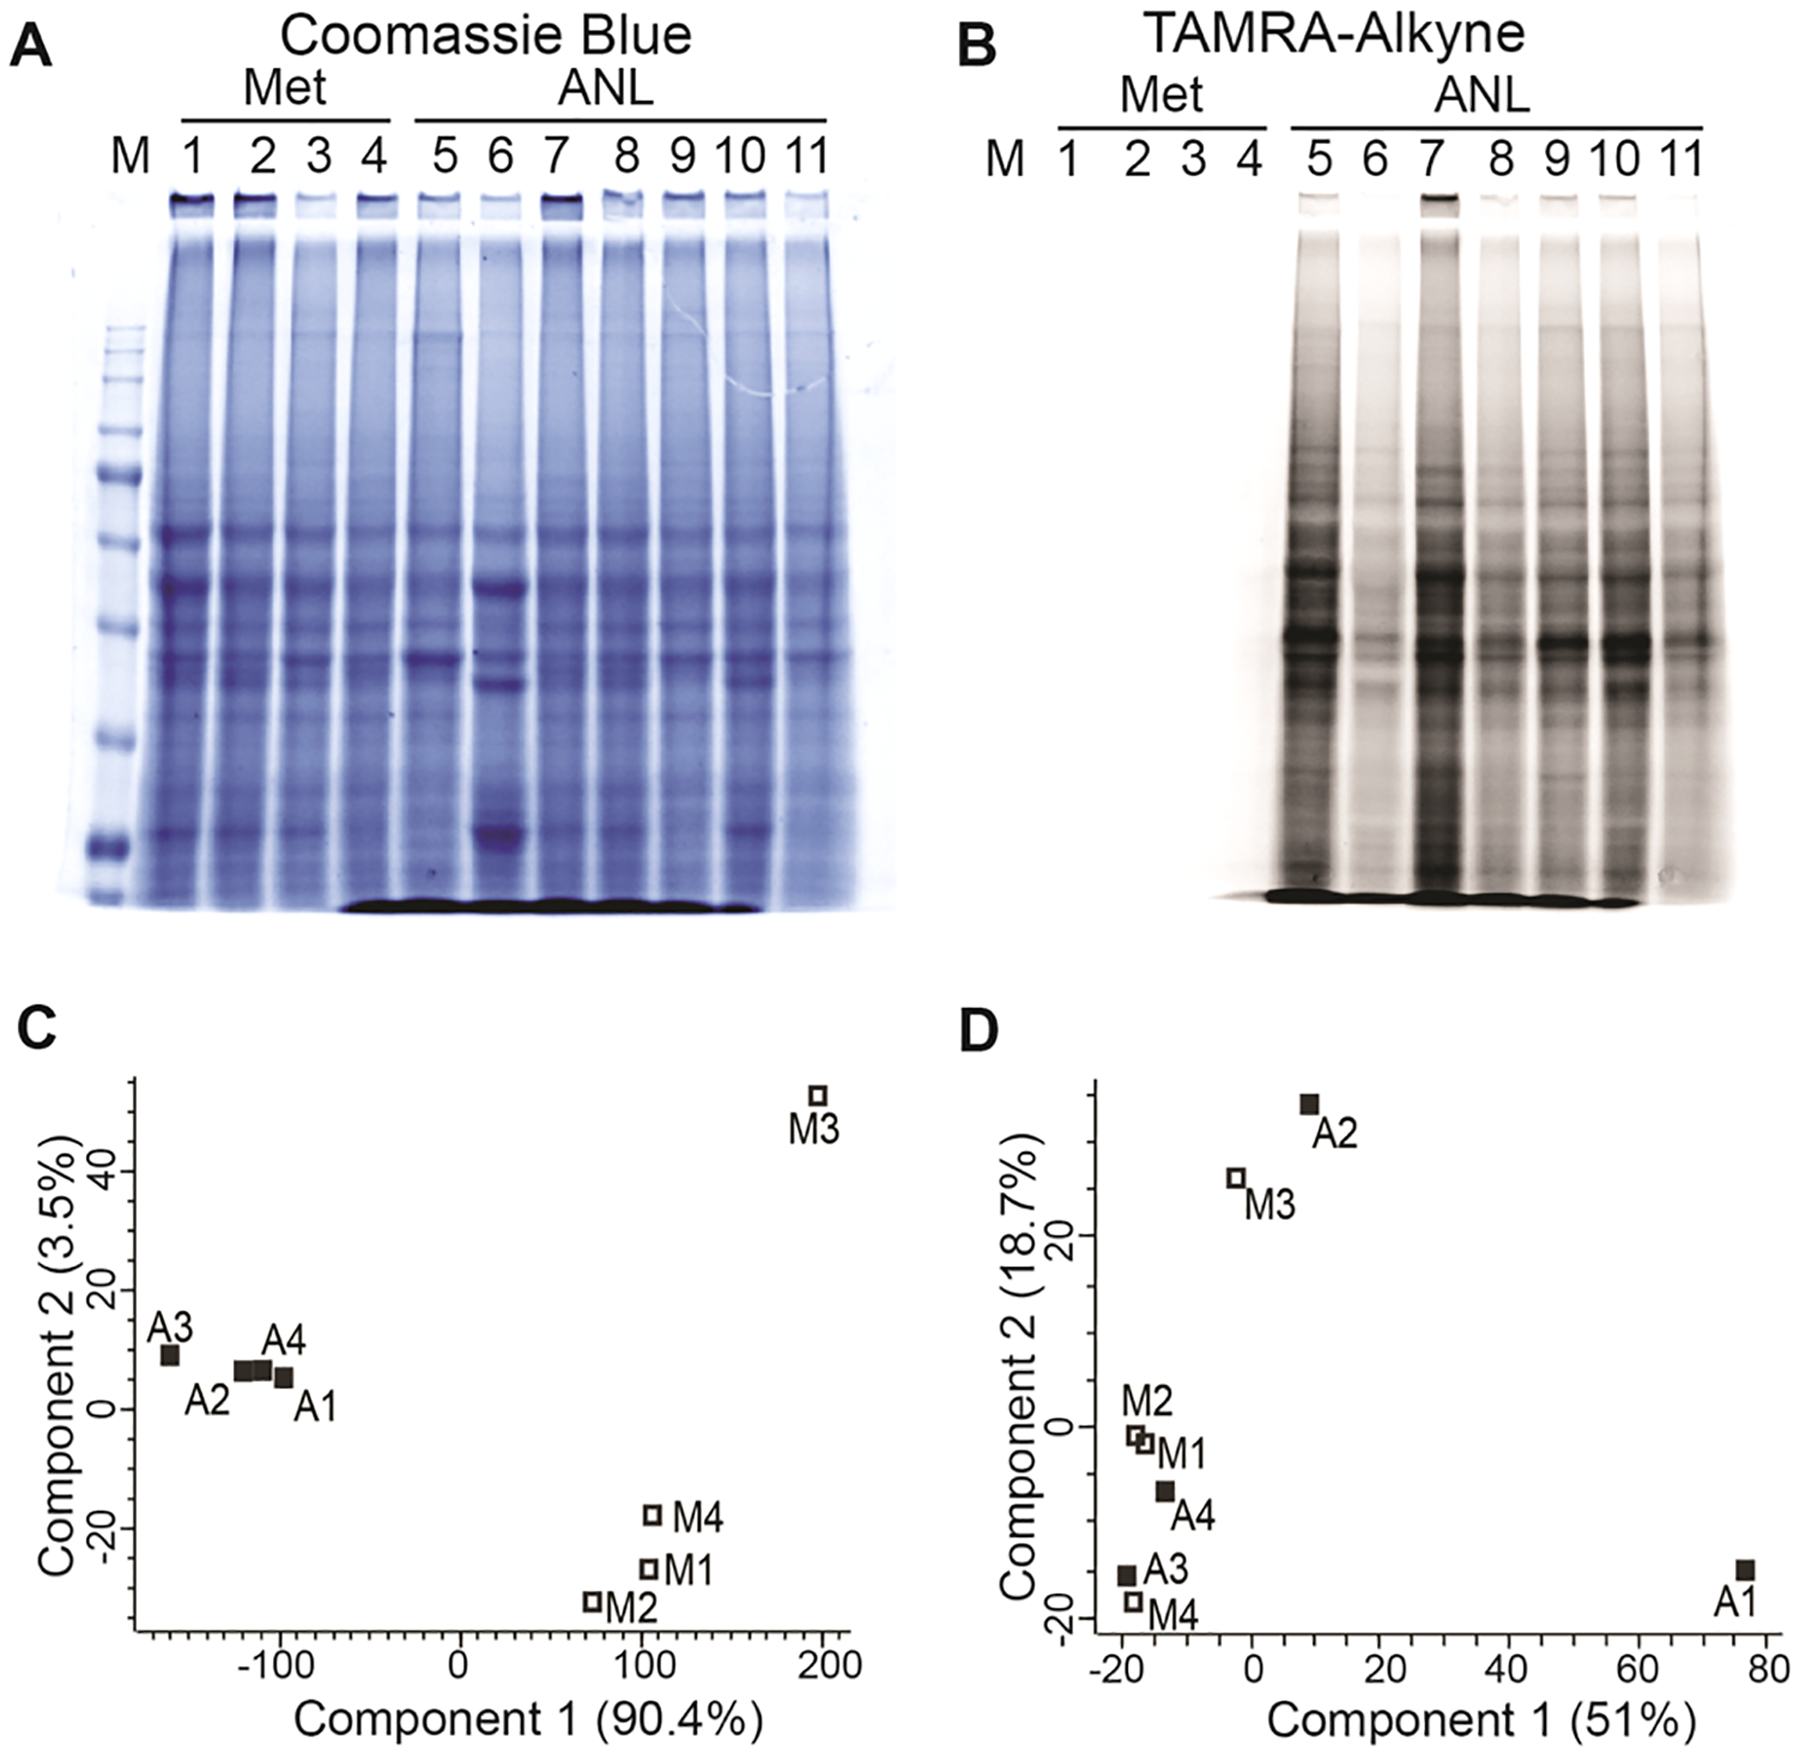
Figure 3.

Quality assessment of BONCAT-enriched samples analyzed by DIA-MS. (A, B) TAMRA-alkyne and SDS-PAGE analysis of 11 in vivo tumor samples labeled with Met (lanes 1–4) or ANL (lanes 5–11). (C) PCA of DIA-MS data for BONCAT-ANL and BONCAT-Met samples. Four tumors are included in the Met (M1, 31C; M2, 30C; M3, 32C; and M4, 33C) and ANL groups (A1, 40A; A2, ANL1; A3, 38A; and A4, 29A). (D) PCA of DIA-MS data for Bulk-ANL and Bulk-Met samples.
