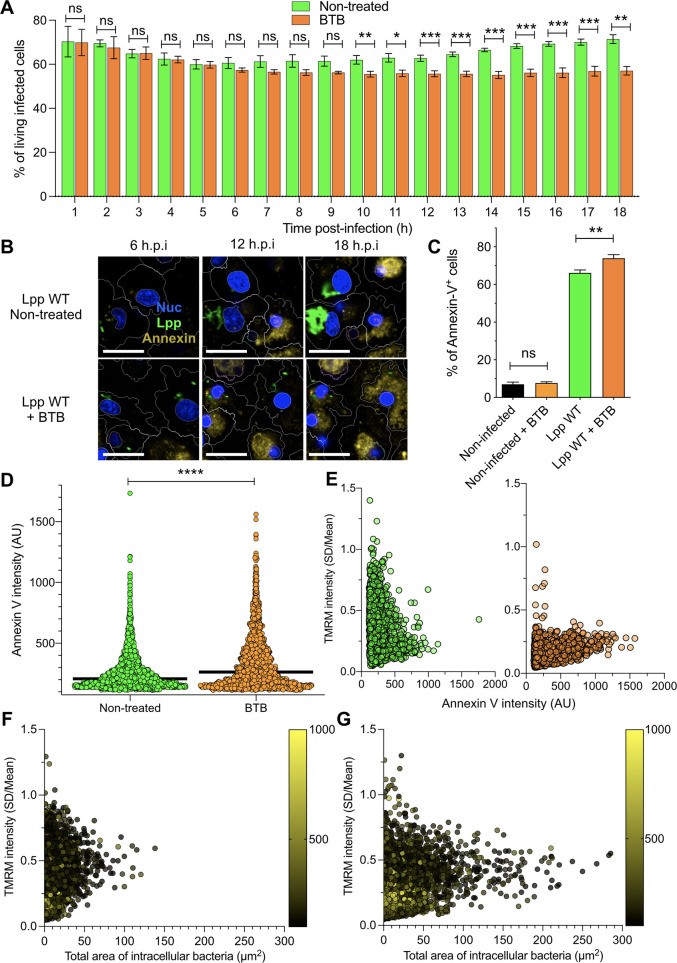
Figure 4. Inhibition of FO-F1 ATPase ‘reverse mode’ increases cell death in L. pneumophila-infected human monocyte-derived macrophages (hMDMs).
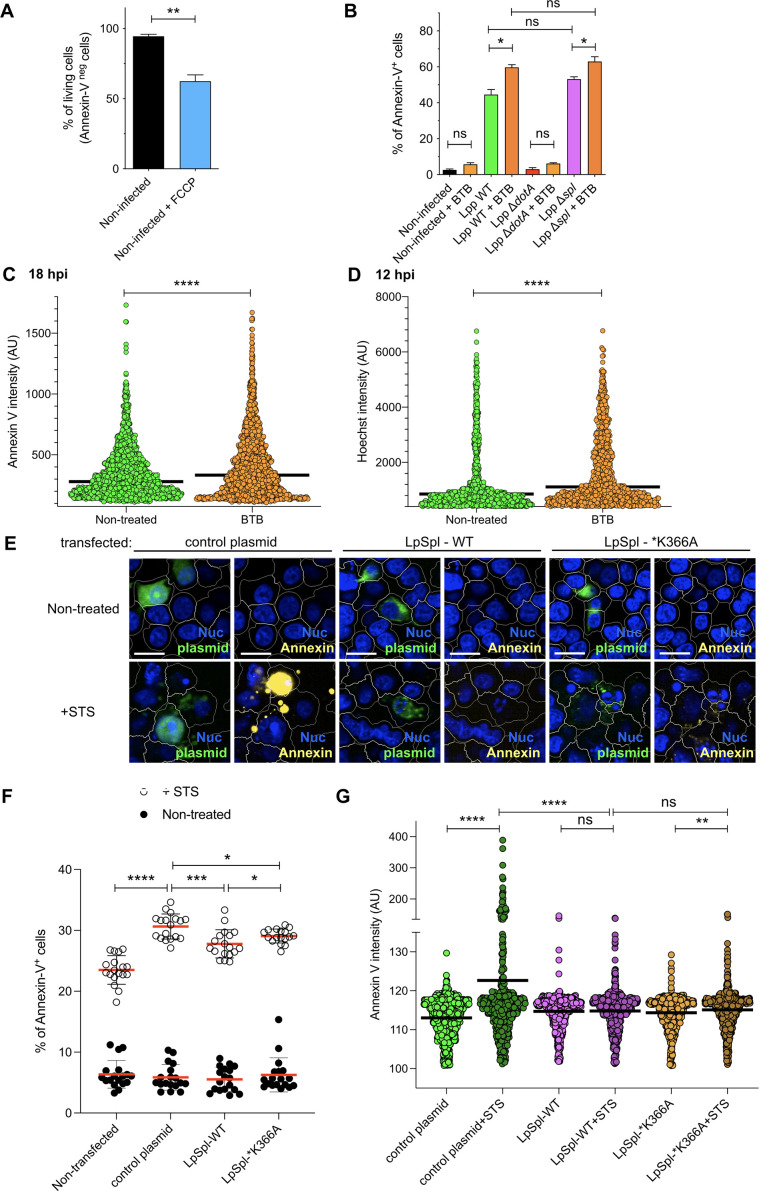
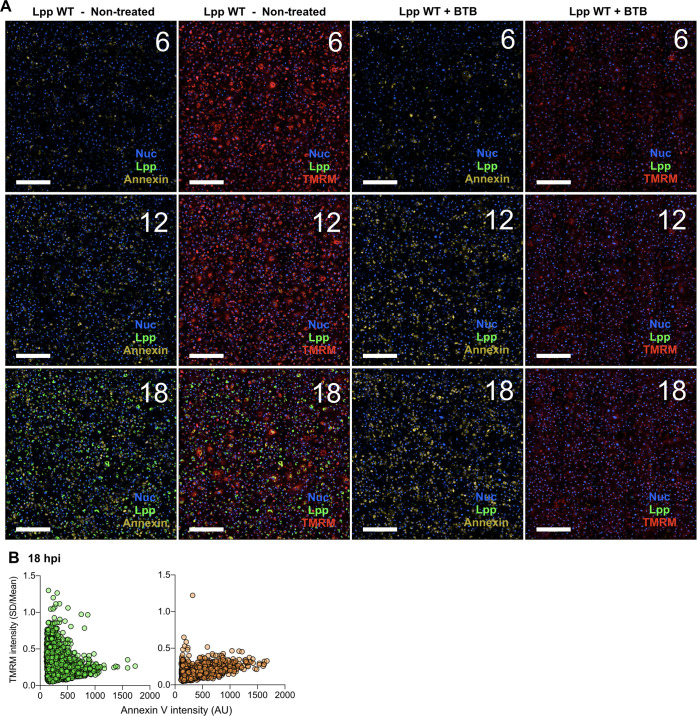
(A) hMDMs were infected with Lpp-WT-GFP and were nontreated or treated with 50 μM BTB. The presence of GFP-expressing bacteria in each cell was monitored, and the number of living infected cells in the whole population was graphed as a percentage of living infected cells. Data from three independent experiments with a total of seven replicates per condition and time point. (B) hMDMs were infected with Lpp-WT-GFP (green), the nuclei of host cells were stained with Hoechst (Nuc, blue), and Annexin-V Alexa Fluor 647 was added to the cell culture to monitor early cell death (Annexin, yellow) from 1 to 18 hr post-infection (hpi) in nontreated or BTB-treated hMDMs. Representative confocal images of nontreated and Lpp-WT-GFP-infected cells at 6, 12, and 18 hpi are shown. Intracellular bacterial replication can be observed in nontreated Lpp-WT-infected hMDMs at 12 and 18 hpi. Bar: 20 μm. (C) hMDMs stained as in (B) were infected with Lpp-WT-GFP or left uninfected (noninfected), and then were treated or not with BTB (50 μM). Percentage of Annexin-V+ cells at 24 hpi is shown. Data from three independent experiments with a total of seven replicates per condition (D) Single-cell analysis (12 hpi) of Annexin-V intensity of the assays described in (B). Single-cell data from one representative experiment (18 hpi shown in Figure 2—figure supplement 1A). (E) hMDMs were infected with Lpp-WT-GFP, nuclei of host cells were stained with Hoechst, and tetramethylrhodamine methyl ester (TMRM) and Annexin-V Alexa Fluor 647 were added to the cells to simultaneously monitor (1–18 hpi) Δψm and early cell death, respectively, in nontreated or BTB-treated hMDMs (representative multifield confocal images in Figure 2—figure supplement 1C). Single-cell analyses (12 hpi) of Δψm (TMRM SD/mean) and cell death (Annexin-V intensity) in more than 1600 cells per condition are shown. Single-cell data from one representative experiment. Green dots, nontreated Lpp-WT-infected single cells; orange dots, BTB-treated Lpp-WT-infected single cells. (F) Same infection conditions as in (E) but using nontreated cells. Bacterial replication was monitored in each single cell infected with Lpp-WT. Single-cell analyses (12 hpi) of Δψm (TMRM SD/mean), area of intracellular GFP-expressing bacteria (μm2), a proxy for intracellular replication, and cell death (Annexin-V intensity) in more than 3800 cells are shown. Single-cell data from one representative experiment; color scale (yellow) represents Annexin-V intensity per cell (AU). (G) Same as in (F) at 18 hpi. *p<0.05; **p<0.01; ***p<0.001; ****p<0.00001; ns, nonsignificant (Mann–Whitney U test).


