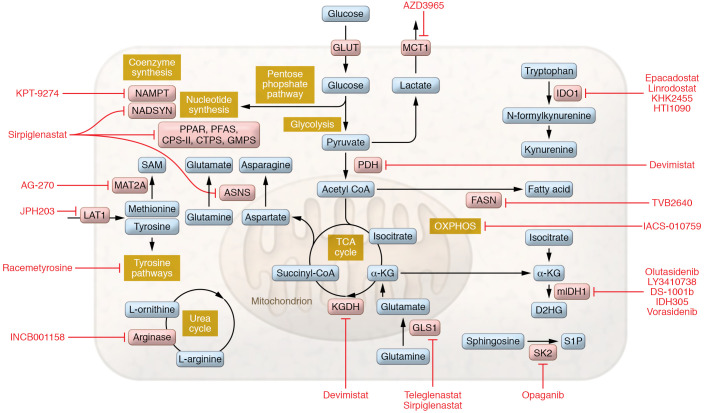
Figure 1. Metabolic inhibitors under clinical investigation for oncology applications.
Schematic depicts the metabolic pathways and processes inhibited by agents described in this Review. Agents are shown in red text. Key enzymes are shown in pink. Pathways are labeled in yellow. Metabolites are shown in blue.

