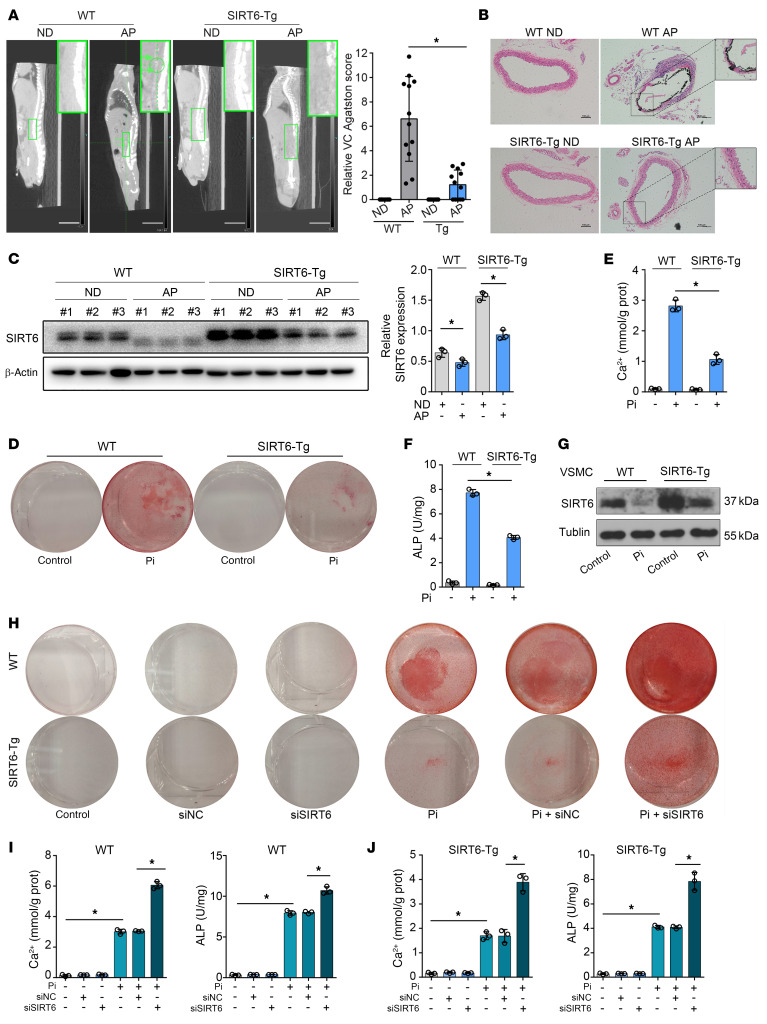
Figure 2. SIRT6 attenuated VC.
(A) Computed tomography (CT) images showing calcification in the abdominal aorta. The green arrows and circle indicated the calcification in abdominal aorta of the WT mouse (n = 12 per group). The bar chart shows the relative VC Agatston score (fold change) of mouse aortas. Scale bars: 10 mm. (B) Representative von Kossa staining of abdominal aorta sections (n = 12 per group). Scale bars: 100 μm. (C) Western blot shows SIRT6 protein in abdominal aorta was reduced in VC. (D and E) VSMCs were exposed to Pi (3.0 mM) for 7 days and then stained for mineralization by Alizarin red (D), and the quantitative analysis of calcium content (E) and ALP (F) were detected (n = 3 per group). (G) SIRT6 protein expression was reduced in WT and SIRT6-Tg VSMCs in response to Pi (3.0 mM) treatment (n = 4 per group). (H–J) WT and SIRT6-Tg VSMCs were pretransfected with siSIRT6 or si-negative control (siNC) and then exposed to Pi (3.0 mM) for 7 days. VSMCs were stained for mineralization by Alizarin red S (H), and calcium content (I) and ALP (J) were quantified (n = 3 per group). Statistical significance was assessed using 1-way ANOVA followed by Dunnett’s test (A, C–F, I, and J). *P < 0.05. All values are mean ± SD.

