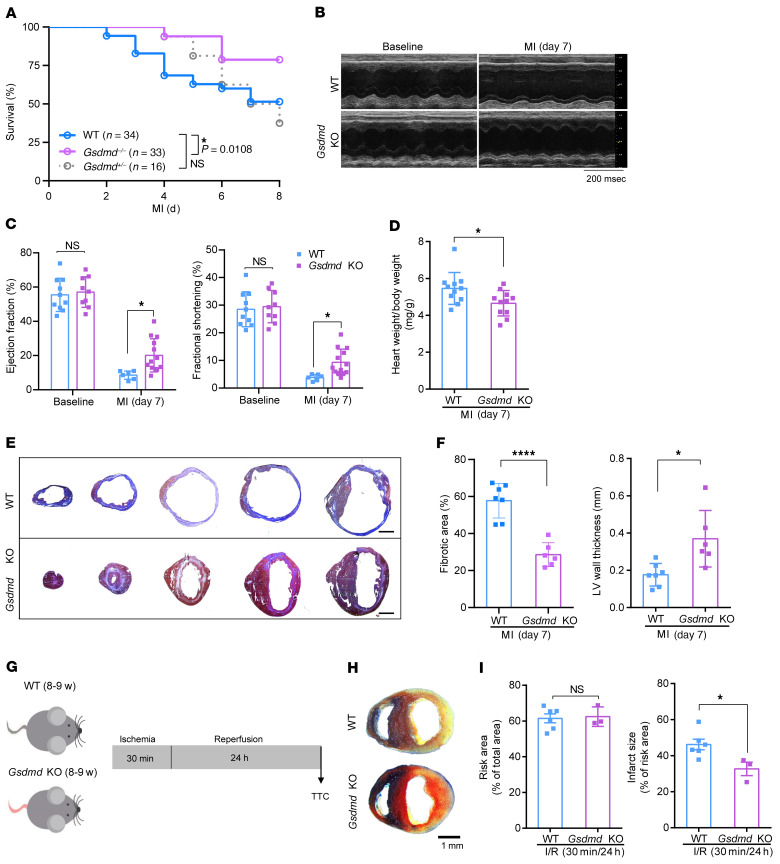
Figure 2. Loss of GSDMD attenuates myocardial injury after AMI.
(A) Kaplan-Meier survival curves comparing post-AMI survival of WT (C57BL/6N) mice (n = 34) to that of Gsdmd−/− mice (n = 33) or Gsdmd+/− mice (n = 16). Statistical significance was determined by Mantel-Cox test. (B and C) Echocardiography images (B) and M-mode quantification (C) of ejection fraction (left) and fractional shortening (right) for WT or Gsdmd−/− mice before or 1 week after AMI (baseline: WT, n = 10; Gsdmd−/−, n = 9; 1 week: WT, n = 6; Gsdmd−/−, n = 12). (D) A comparison of heart weight/body weight ratio between WT mice and Gsdmd−/− mice 1 week after AMI (WT, n = 11; Gsdmd−/−, n = 11). (E and F) Masson’s trichrome staining (E) and quantification of fibrotic area and left ventricular (LV) wall thickness (F) of short-axis heart sections from WT or Gsdmd−/− mice 1 week after AMI (WT, n = 7; Gsdmd−/−, n = 6). Scale bar: 1 mm. (G) Schematic diagram showing the ischemia/reperfusion (I/R) surgery strategy for WT and Gsdmd−/− mice. (H and I) Representative images of Evans blue dye and triphenyltetrazolium chloride (TTC) staining (H) and quantification of risk area (left) and infarct size (right) (I) for WT or Gsdmd−/− mice after I/R surgery (WT, n = 6; KO, n = 3). Data are presented as mean ± SD. *P < 0.05; ****P < 0.0001, as analyzed by 1-way ANOVA followed by Bonferroni’s multiple comparison test (C) or unpaired, 2-tailed Student’s t test (D, F, and I). NS, not significant.

