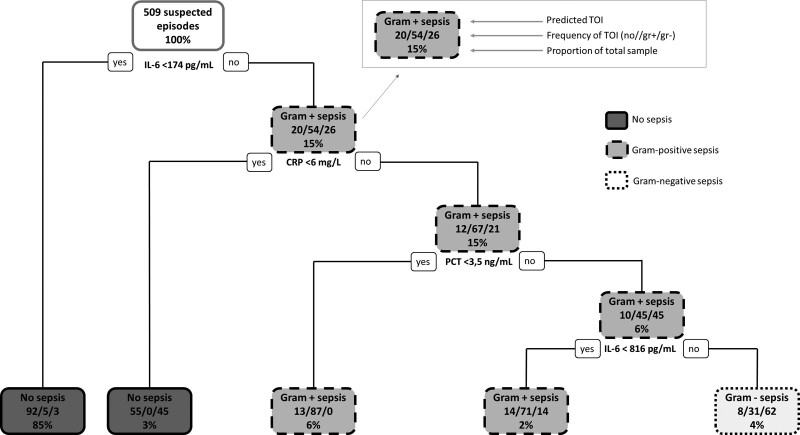
Figure 2.
Classification tree resulting from RPART analysis of all 2018–2020 data. For each branch, to the left indicates that the patient meets the condition, and to the right, the patient does not meet the condition. The probabilities for the types of infections are depicted next to each other in every node (no infection–Gram-positive sepsis–Gram-negative sepsis). The frequency depicted at the bottom of the node is the proportion of the total sample that is in this category. CRP = C-reactive protein, gr– = Gram-negative sepsis, gr+ = Gram-positive sepsis, IL-6 = interleukin-6, no = no sepsis, PCT = procalcitonin, TOI = type of infection.

