Figure 5.
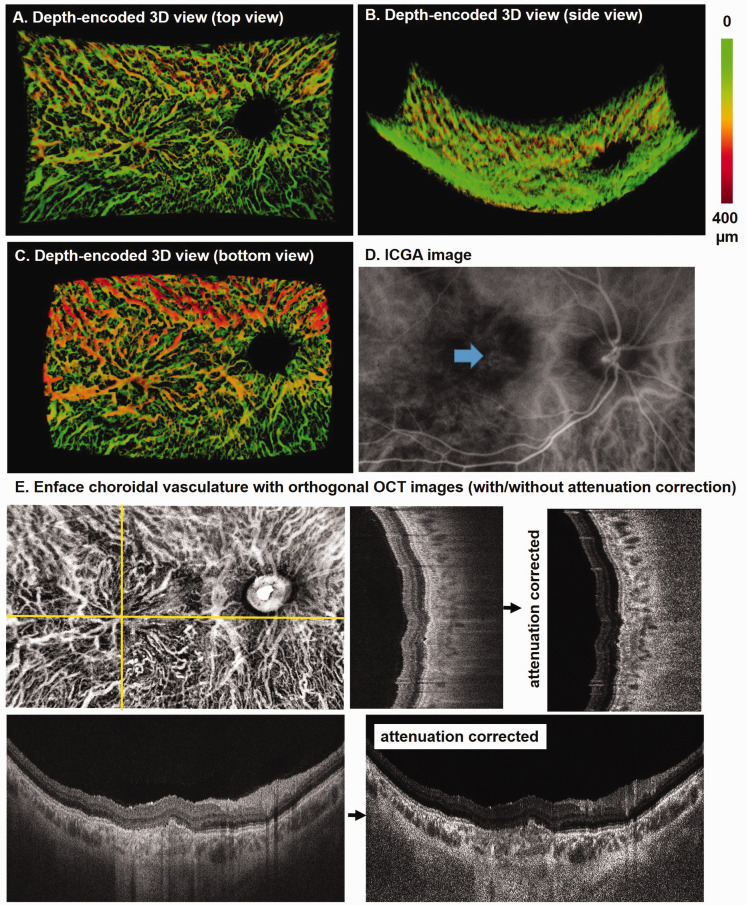
Depth-encoded 3D visualization of the right eye of a 19-year-old male patient with resolved central serous chorioretinopathy. Top view from the vitreous (a), side view from the peripheral retina (b), and bottom view from the sclera (c) of the choroidal vessels segmented from an SS-OCT dataset. (d) The corresponding ICGA image shows shadows at macula (arrow). (e) En face choroidal vasculature map with orthogonal SS-OCT images with and without attenuation correction. (A color version of this figure is available in the online journal.)
ICGA: indocyanine green angiography; OCT: optical coherence tomography.

