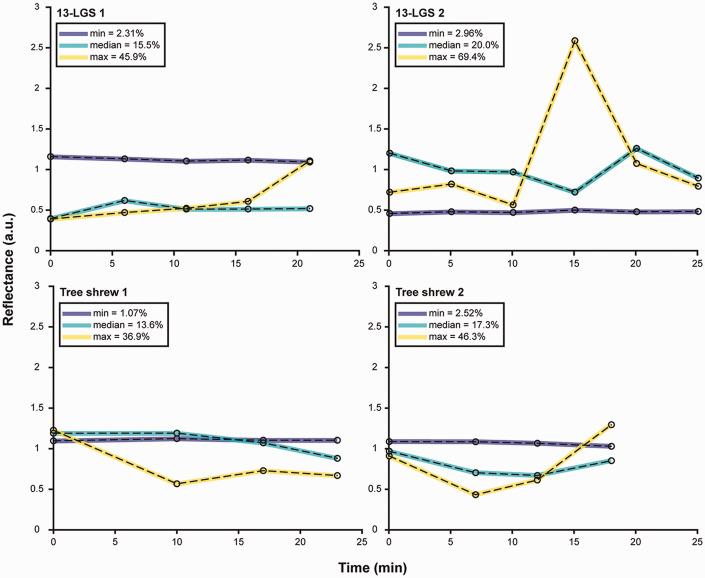
Figure 4.
Temporal cone reflectance traces for each animal depicting the cone with the minimum (blue), median (cyan), and a maximum (yellow) coefficient of variation across time points. The coefficient of variation expressed in percentage can be seen in the legend in the upper left corner of each plot. Individual cone behavior varied for each animal and variable cone traces showed diverse levels of oscillation and overall slope changes.

