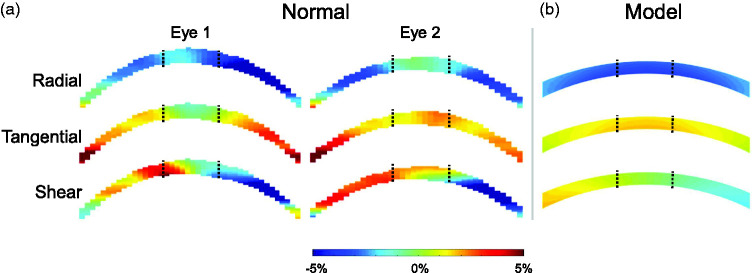
Figure 4.
(a) Radial, tangential, and shear strain maps in two normal corneas at 30 mmHg. Black dotted lines demarcate the central and paracentral regions. (b) Radial, tangential, and shear corneal strain maps generated from finite element simulations of a human eye inflated from 5 to 30 mmHg. (A color version of this figure is available in the online journal.)

