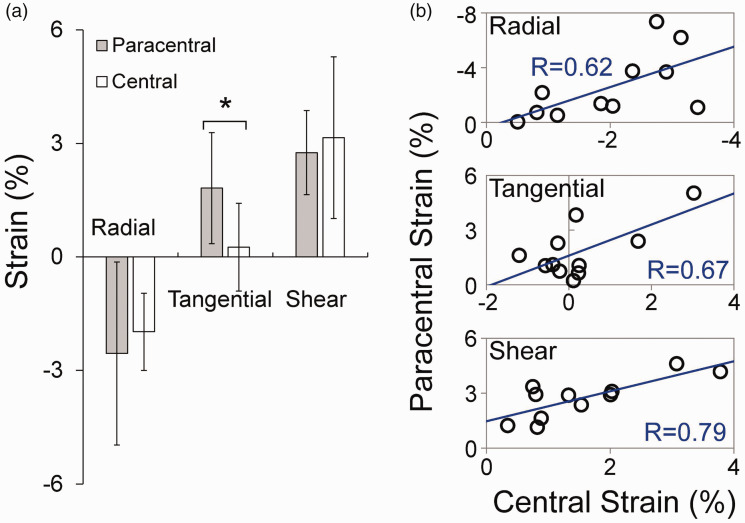
Figure 5.
(a) Comparisons of radial, tangential, and shear strains between central and paracentral corneal stroma at 30 mmHg in normal corneas (n = 11, * denotes P < 0.05). (b) Correlation of strains between central and paracentral regions (n = 11, R=Pearson correlation coefficient). (A color version of this figure is available in the online journal.)

