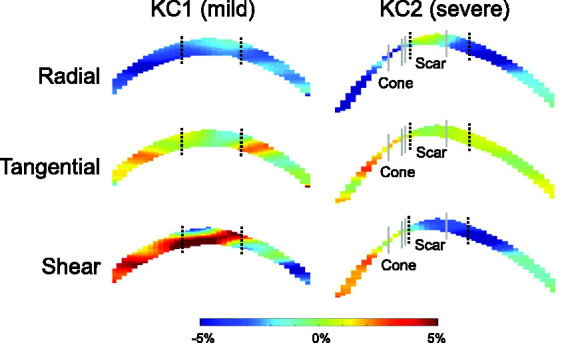
Figure 6.

Radial, tangential, and shear strain maps of KC1 (mild) and KC2 (severe) at 30 mmHg. Black dotted lines demarcate the central and paracentral regions. Gray lines demarcate the cone and scar regions in KC2. (A color version of this figure is available in the online journal.)
