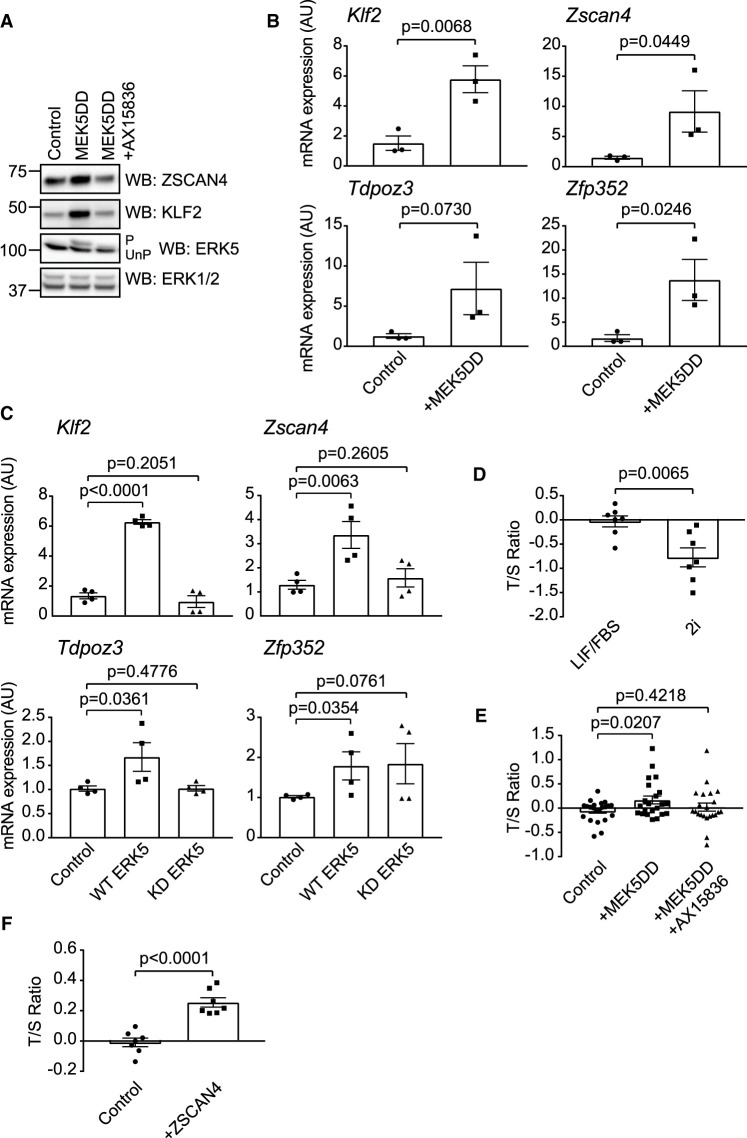
Figure 2. ERK5 promotes ZSCAN4/2-cell stage gene expression and mESC telomere elongation.
(A) mESCs were transfected with empty vector control or MEK5DD for (48 h) and treated with either DMSO or 10 µM AX15836 (24 h prior to lysis). ERK5 activation was assessed by band-shift following ERK5 immunoblotting (P = phosphorylated active ERK5, UnP = unphosphorylated inactive ERK5) and by KLF2 induction. Expression levels of ZSCAN4 were determined by immunoblotting. ERK1/2 was used as a loading control. (B) mESCs were transfected with either empty vector or MEK5DD. mRNA levels of Klf2, Zscan4, Tdpoz3 and Zfp352 were determined by qRT-PCR. Klf2 induction is used as a positive control for ERK5 activity. Each data point represents one biological replicate calculated as an average of two technical replicates (n = 3). Error bars represent mean ± SEM. Statistical significance was determined by student t-test. (C) Erk5/Mapk7−/− mESCs were transfected with MEK5DD and either empty vector, wild-type ERK5 or kinase inactive (D200A) ERK5. mRNA levels of Klf2, Zscan4, Tdpoz3 and Zfp352 were determined by qRT-PCR. Klf2 induction is used as a positive control. Each data point represents one biological replicate calculated as an average of two technical replicates (n = 3). Error bars represent mean ± SEM. Statistical significance was determined by student t-test. (D) Genomic DNA from mESCs maintained in LIF/FBS or 2i media was subjected to qPCR using primers against the telomeric repeats (T) and a single locus control region (S). T/S ratio was calculated to give the average relative telomere length. Each data point represents one biological replicate calculated as the average of three technical replicates (n = 7). A power calculation was used to determine sample size, which was randomly selected from biological replicates. Error bars represent mean ± SEM. Statistical significance was determined by student t-test. (E) Genomic DNA from mESCs transfected with either empty vector or MEK5DD (48 h) and treated with either DMSO or 10 µM AX15836 (24 h prior to lysis) was collected and subjected to qPCR using primers against the telomeric repeats (T) and a single locus control region (S). T/S ratio was calculated to give the average relative telomere length. Each data point represents one biological replicate calculated as the average of three technical replicates (n = 22). A power calculation was used to determine sample size, which was randomly selected from biological replicates. Error bars represent mean ± SEM. Statistical significance was determined by student t-test. (F) Genomic DNA from mESCs transfected with either empty vector or ZSCAN4 (48 h) was collected and subjected to qPCR using primers against the telomeric repeats (T) and a single locus control region (S). T/S ratio was calculated to give the average relative telomere length. Each data point represents one biological replicate calculated as the average of three technical replicates (n = 7). A power calculation was used to determine sample size, which was randomly selected from biological replicates. Error bars represent mean ± SEM. Statistical significance was determined by student t-test.

