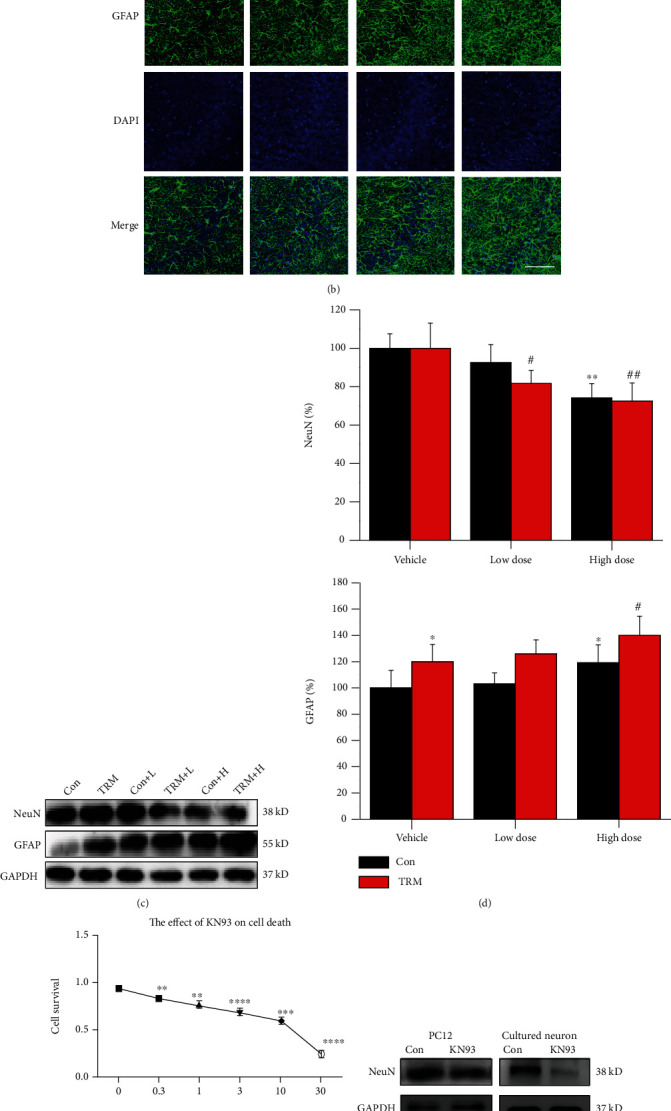
Figure 3.

CaMKII inhibition induces neuronal death in vivo and in vitro. (a) Cresyl violet stain images showing the hippocampi of Wistar rats, TRM rats, KN93-treated (high dose) Wistar rats, and KN93-treated (high dose) TRM rats, including the CA1, CA3, and DG regions. The arrows indicated survived neurons, and the arrowheads indicated dead neurons. Scale bars: 20 μm. (b) Representative images showing the immunofluorescence staining of GFAP in the CA3 regions of the hippocampi of Wistar rats, TRM rats, KN93-treated Wistar rats, and KN93-treated TRM rats. Scale bars: 100 μm. (c, d) Representative protein bands and analysis of data for NeuN and GFAP protein expression in the hippocampi of Wistar rats, TRM rats, KN93-treated (low dose) Wistar rats, KN93-treated (low dose) TRM rats, KN93-treated (high dose) Wistar rats, and KN93-treated (high dose) TRM rats. ∗p < 0.05, compared with the control Wistar group; #p < 0.05, compared with control TRM group; ∗∗p < 0.01, compared with control Wistar group; ##p < 0.01, compared with the control TRM group. (e) The concentration-dependent cytotoxicity curve of KN93 on PC12 cells at concentrations of 0.3, 1, 3, 10, and 30 μM. ∗∗p < 0.01, ∗∗∗p < 0.001, and ∗∗∗∗p < 0.0001 compared with controls. (f, g) Expression and localization of NeuN-positive neurons and its data analysis in primary hippocampal neurons of the control group and KN93-treated group. ∗p < 0.05, compared with the control group; ∗∗p < 0.01, compared with the control group.
