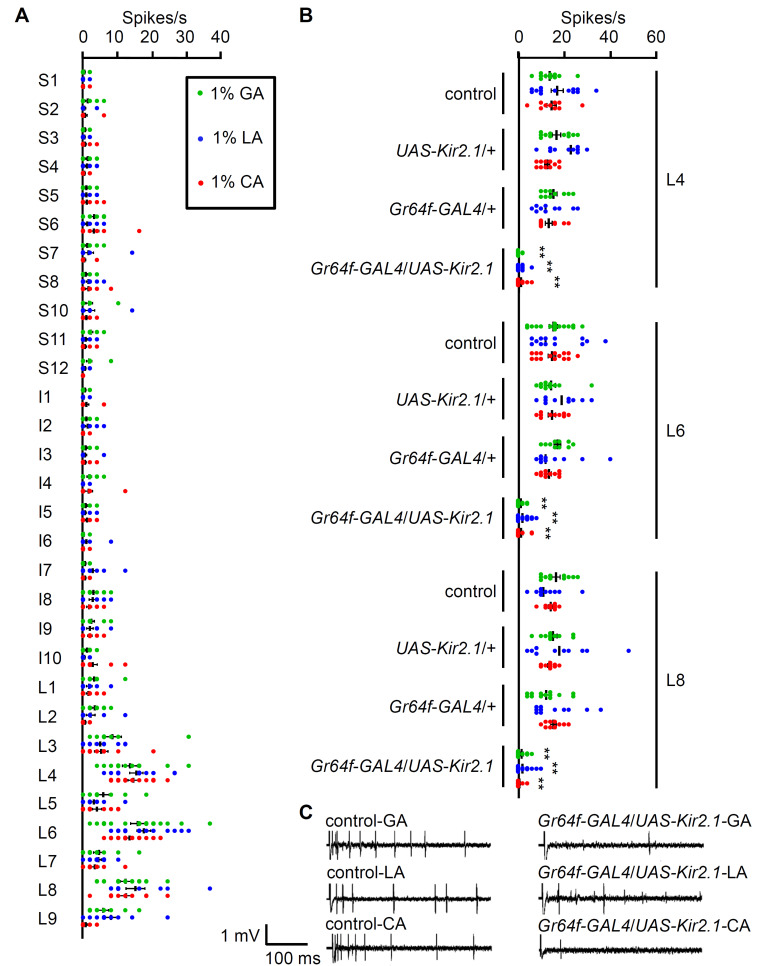
Fig. 2. 1% carboxylic acid-induced neuronal responses in the labellum.
(A) 1% GA, 1% LA, and 1% CA were tested from all the labellar sensilla for electrophysiology mapping (n = 10-18). All error bars represent the SEM. (B) Tip recordings from L4, L6, and L8 sensilla after inactivating sweet-sensing GRNs using UAS-Kir2.1 under the control of Gr64f-GAL4 (n = 10-15). All error bars represent the SEM. Multiple sets of data were compared using single-factor ANOVA coupled with Scheffe’s post hoc test. Asterisks indicate statistical significance compared with the controls (**P < 0.01). (C) Representative sample traces of (B).

