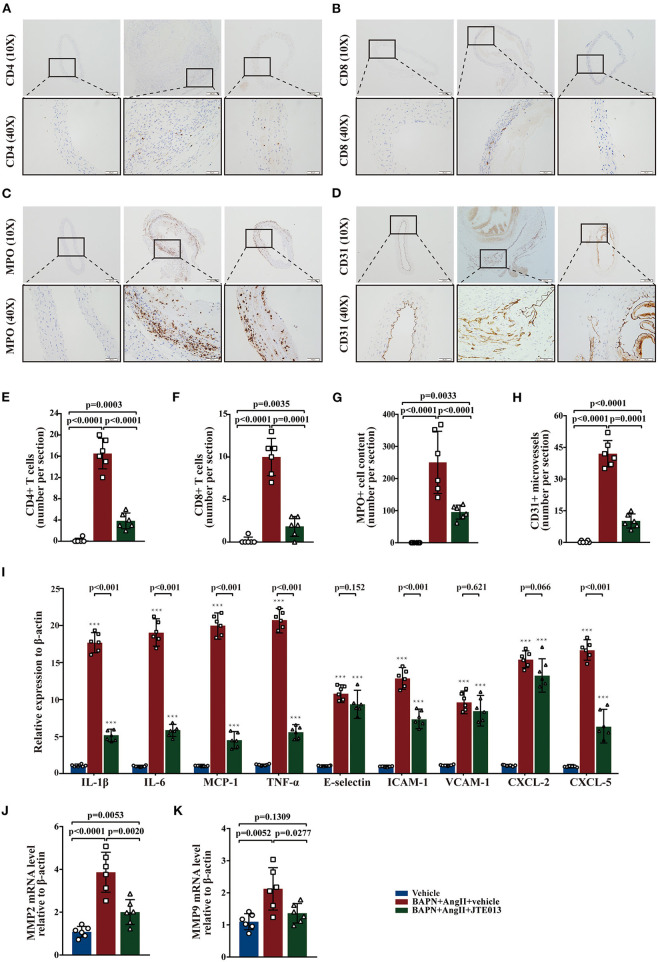
Figure 4.
Inhibition of S1PR2 by JTE013 reduced inflammatory infiltration and angiogenesis. (A,E) Lesion CD4+ T-cell numbers and corresponding analysis. (B,F) Lesion CD8+ T-cell numbers and corresponding analysis. (C,G) Lesion MPO+ neutrophil numbers and corresponding analysis. (D,H) Lesion CD31+ micro-vessel numbers and corresponding analysis. (I) RT-qPCR determined lesion mRNA levels of IL-1β, IL-6, MCP-1, TNF-α, E-selectin, ICAM-1, VCAM-1, CXCL-2, and CXCL-5. (J,K) Analysis of MMP2 and MMP9 mRNA expression. n = 6 mice per group. ***p < 0.001 vs. the vehicle group. Scale: 200 μm, inset: 50 μm. Data are expressed as means ± SD. Myeloperoxidase (MPO), a marker for neutrophil abundance.

