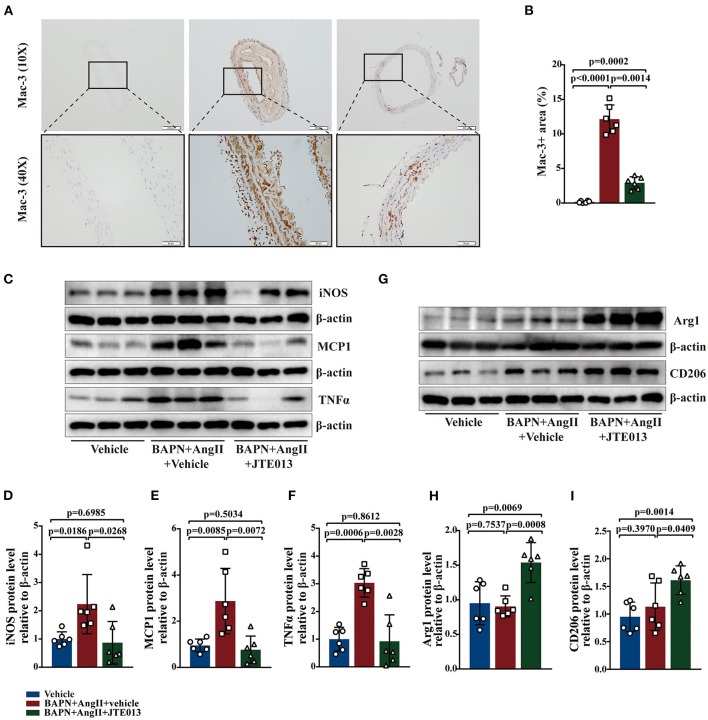
Figure 5.
Inhibition of S1PR2 by JTE013 diminished macrophages accumulation and the hallmarks of M1 macrophage. (A,B) Lesion Mac-3+ area and corresponding analysis (n = 6). (C–F) Representative immunoblot and the corresponding analysis of mouse iNOS, MCP1, and TNFα in each group (n = 6). (G–I) Representative immunoblot and the corresponding analysis of mouse Arg1 and CD206 (n = 6). Scale: 200 μm, inset: 50 μm. Data are expressed as means ± SD.

