
Figure 5.
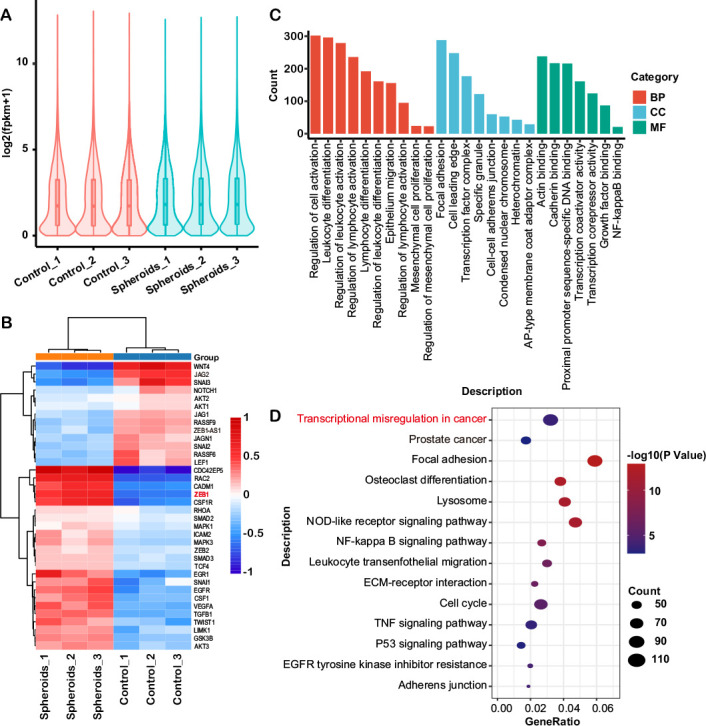
(A) Violin plots show the gene expression level of each sample, the width of each violin represents the number of genes under this expression level. (B) Hierarchical clustering of the differentially expressed genes associated with EMT in the OvCa cells and OvCa cells isolated from spheroids (p<0.05). Each group contains three samples. (C) GO classification of differential expressed genes in comparisons between OvCa cells and OvCa isolated from spheroids. The ordinate is the number of differentially expressed genes and the abscissa represents the GO term name. Orange represented biological process, blue represented cellular component and green represented molecular function. (D) KEGG pathway analysis revealed the enrichment of several important pathways among the differential expressed genes, including transcriptional misregulation in cancer and focal adhesion. EMT, epithelial-mesenchymal transition; GO, gene ontology; KEGG, Kyoto Encyclopedia of Genes and Genomes; OvCa, ovarian cancer; TNF, tumor necrosis factor.