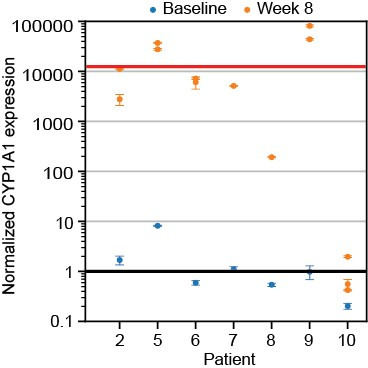
Figure 4.

CYP1A1 expression in one to two colon tissues each from seven patients, measured by quantitative real-time PCR. The black line indicates average normalised baseline expression and the red line marks the average normalised increase (12 557-fold). Error bars represent propagated errors from CYP1A1 (n=4) and 18S (n=4) levels measured simultaneously for sample normalisation. CYP1A1, cytochrome P450 1A1.
