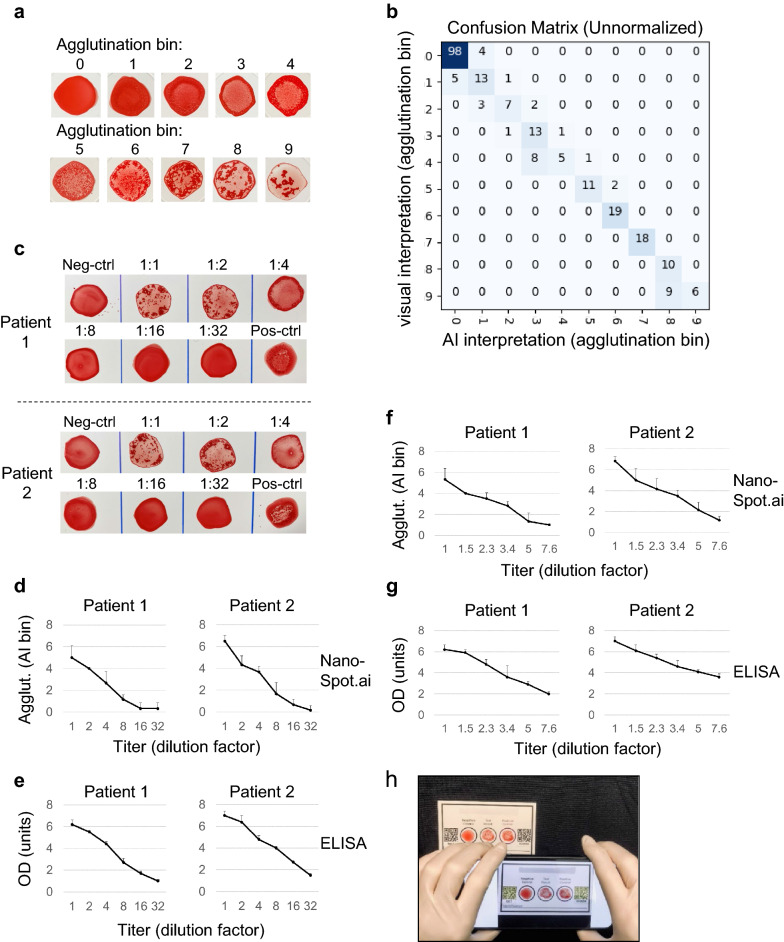
Figure 6.
Quantitative assessment of hemagglutination titers using NanoSpot.ai. (a) Master palette of hemagglutination samples selected based on visual appearance and reflecting a range of agglutination from 0 (no agglutination) to 9 (strongest agglutination). (b) Confusion matrix based on visual and AI-based interpretation of agglutination samples (holdout set), which had not been shown to AI before. (c–g) Correlation of AB-titer with visual appearance of hemagglutination (c), AI-based interpretation (d,f) and ELISA (e,g). Serum samples of two COVID-19-positive patients were titrated (in COVID-19-negative serum) and analyzed by indicated methods. Agglutination was terminated when close to fully developed (corresponding to AI-bin 6–8). twofold (c–e) and 1.5-fold (f,g) dilution steps were used as indicated. Error bars represent mean ± Std dev based on six (d,f (AI)) or three (e,g (ELISA)) replicates. (h) Setting used for data acquisition, including test card, cell phone and mobile app capturing image.

