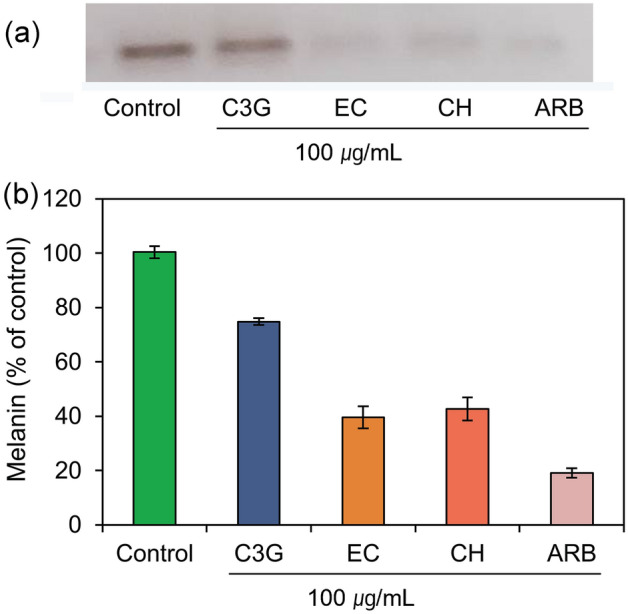
Figure 12.

Zymogram analysis for the inhibition of the murine tyrosinase incubated with selected bioactive compounds, i.e., C3G, EC, and CH, and positive control compound, viz. ARB inhibitor at 100 µg/mL concentration. Here, (a) zymograms show the reduction in dark black color corresponds to the o-quinone production by the activity of murine tyrosinase and (b) measured color intensity of the produced bands with standard deviations from the triplicate experimental data.
