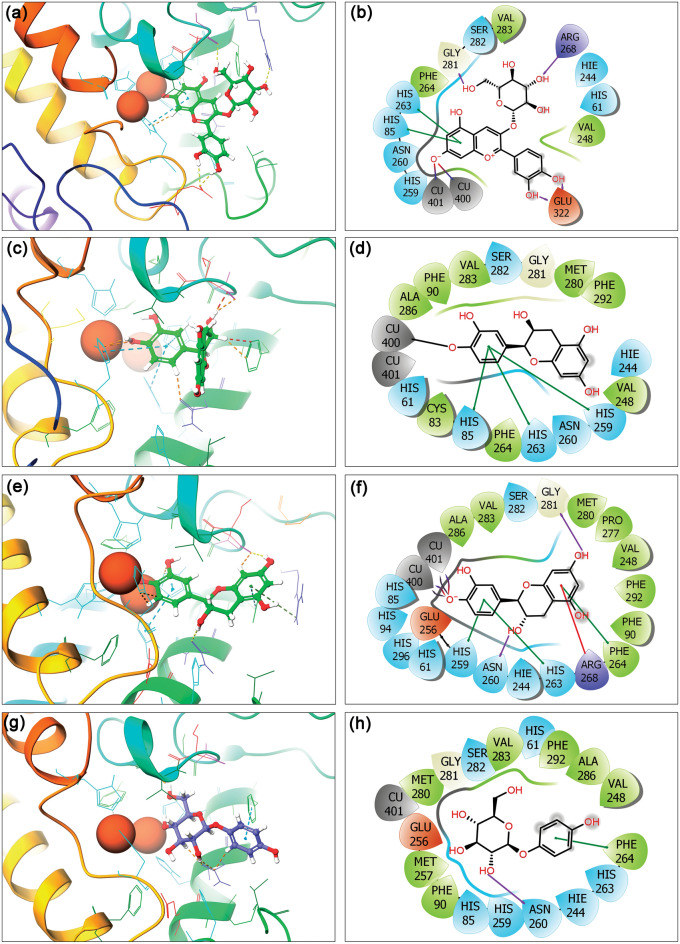
Figure 2.
3D and 2D interaction poses for the mh-Tyr protein docked with (a, b) cyanidin-3-O-glucoside (C3G), (c, d) (−)-epicatechin (EC), (e, f) (+)-catechin (CH), and (g, h) arbutin (ARB inhibitor) as positive control. In 2D interaction maps, hydrogen bond (pink arrows), π–π (green lines), π–cation (red lines), hydrophobic (green), polar (blue), negative (red), positive (violet), glycine (grey), metal coordination bond (black line), and salt bridge (red-violet line) interactions are depicted in the respective docked complexes. All the images were generated using free academic Schrödinger-Maestro v12.6 suite40; https://www.schrodinger.com/freemaestro.

