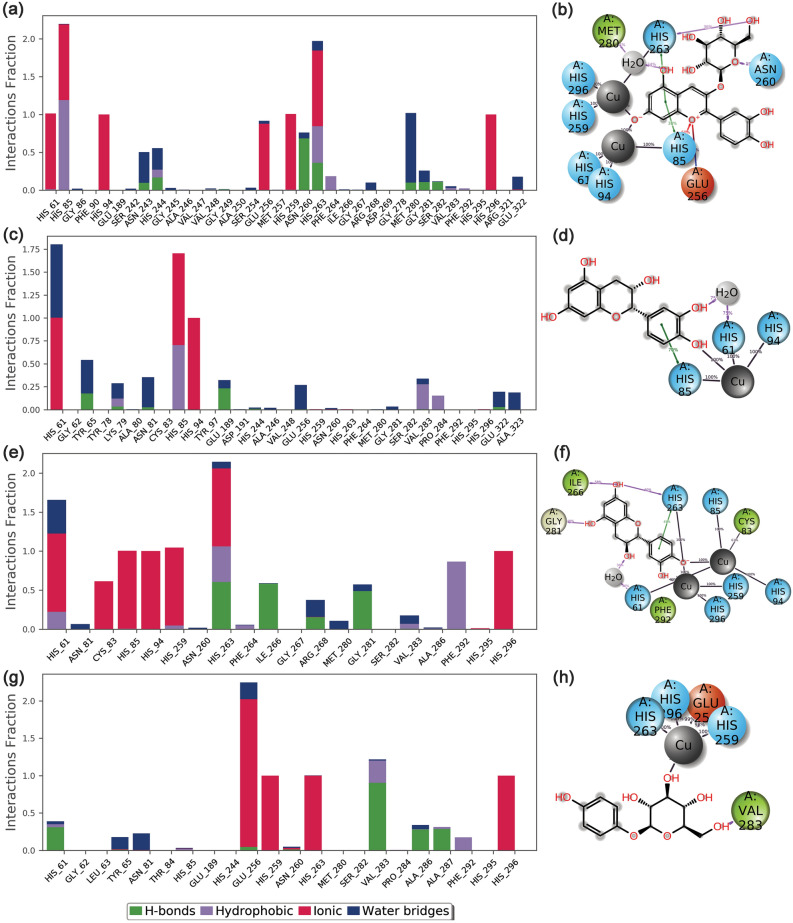
Figure 6.
Protein–Ligand contact mapping for the mh-Tyr protein docked with selected compounds, i.e., (a, b) C3G, (c, d) EC, (e, f) CH, and (g, h) ARB inhibitor, extracted as a function of 100 ns MD simulation interval. Herein, 2D interaction maps exhibit 30% of the total interaction that occurred between the atoms and residues in the respective docked complexes. These images were rendered using the SID module in the free academic version of Desmond v5.649; https://www.deshawresearch.com/resources_desmond.html.

