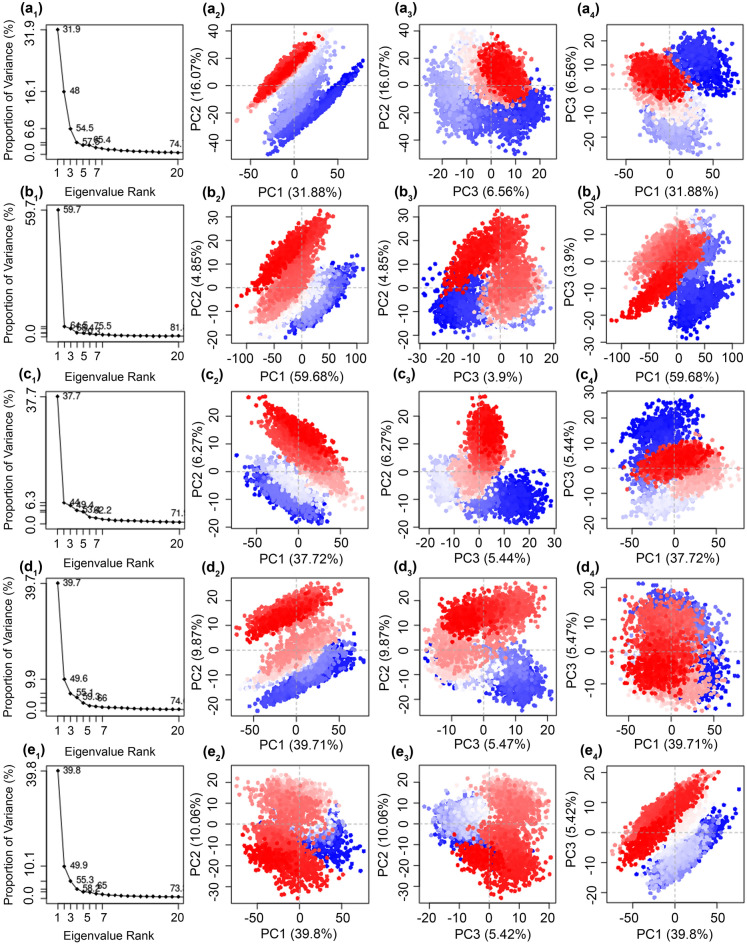
Figure 7.
Principal component analysis of the mh-Tyr docked complexes with (a) C3G, (b) EC, (c) CH, and (d) ARB inhibitor against the (e) apo-mh-Tyr protein. The instantaneous conformations of mh-Tyr protein are colored from blue to red through white color in order of time (0–100 ns) in the respective scatter plots, which signify the periodic jumps at different intervals of the 100 ns MD simulation. Images were generated using default parameters in Bio3d package (Released version 2.4–1; http://thegrantlab.org/bio3d/)51 under R environment (R version 4.0.4; http://mirror.fcaglp.unlp.edu.ar/CRAN/)52.

