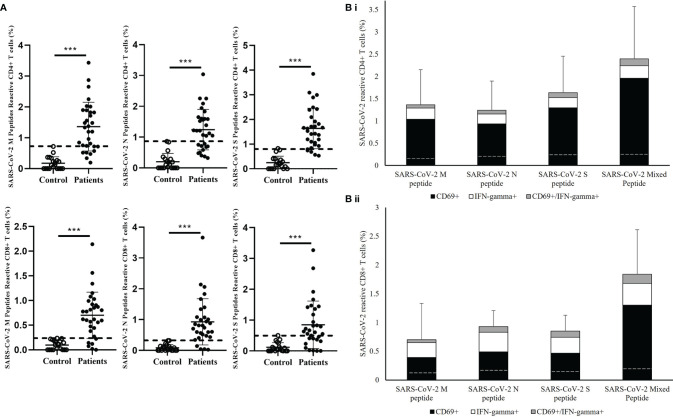
Figure 2.
Measurement of SARS-CoV-2-specific T cell response in in healthy controls and recovered pediatrics patients. (A) Comparison of T cell responses stimulated by SARS-CoV-2 Membrane (M), Nuclear (N), Spike (S) peptides in the recovered COVID-19 patients and uninfected controls. Dash line indicated the measured T cell responses reference obtained from the uninfected controls. Data are presented as mean ± SD and analyzed using two-sided Student’s t-test between control and patient groups. ***p < 0.001 (B) Total T cell responses towards SARS-CoV-2 M, N,S peptides and mixed peptide pools in stacked columns representing the summation of different measured immune subsets in (i) CD4+ and (ii) CD8+ T cells after 16 hours of incubation of PBMCs from recovered patient. Data are expressed as mean ± SD. Dash line in the stack columns indicated the corresponding reference CD4+ and CD8+ T cells response stimulated by different SARS-CoV-2 peptide in uninfected controls group.

