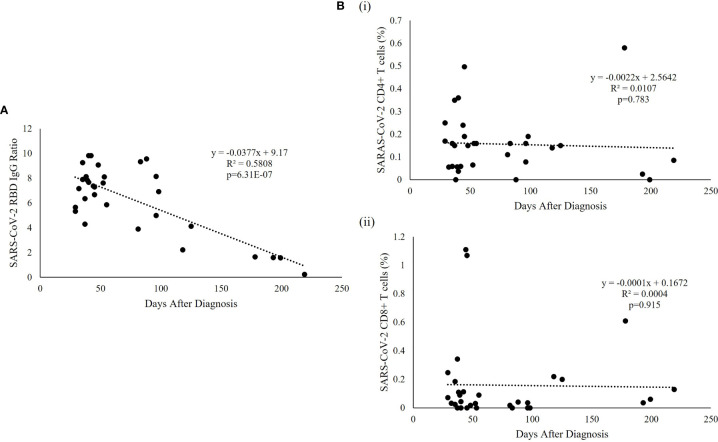
Figure 3.
SARS-CoV-2-specific RBD and T cell responses over time. (A) Regression analysis of the measured RBD IgG ratio in convalescent serum was plotted against the days after diagnosis. The best fitting trendline is shown. The calculated t1/2 was 121.6 days and the estimated duration of antibodies was 7.9 months compared with the average basal level obtained from uninfected individuals. (B) Representative T cell subset frequencies in PBMC of recovered patients were plotted against the post-infection period showing a flat slope for (i) CD4+ and (ii) CD8+, indicating a sustained T cell response to SARS-CoV-2 virus in recovered pediatric patients.

