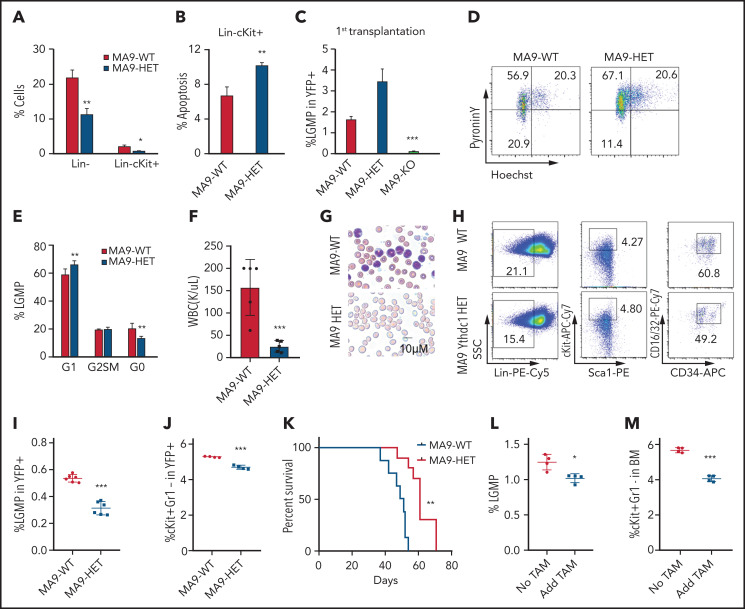
Figure 3.
Ythdc1 plays a crucial role in leukemia stem cell maintenance. (A) Flow cytometric analysis of percentage of Lin– and Lin–cKit+ in MLL-AF9-WT and MLL-AF9-Ythdc1 HET cells, which were cultured in liquid medium with cytokines for 7 days. (B) Flow cytometric analysis of apoptosis percentage of Lin–cKit+ population from MLL-AF9-WT and MLL-AF9-Ythdc1 HET cells. (C) Flow cytometric analysis of percentage of L-GMP (Lin−c-Kit+Sca1−CD34+FcR-ϒ+) in BM cells from MLL-AF9-WT (MA9-WT), MLL-AF9-Ythdc1 HET (MA9-HET), and MLL-AF9-Ythdc1 KO (MA9-KO) leukemic mice. Mice were euthanized at the same time point, and BM cells were harvested for analysis when the mice (WT and HET) became moribund; n = 6 mice for the WT and HET groups, n = 4 mice for the KO group. (D-E) Flow cytometric analysis of LSC quiescence in MLL-AF9-WT (MA9-WT) and MLL-AF9-Ythdc1 HET (MA9-HET) primary mice. Gating strategy is shown in panel D. Cells were stained with DNA Dye Hoechst and RNA Dye Pyronin Y. Double-negative population indicated the G0 phase/quiescence; n = 6 mice for each group. (F) Complete blood cell count analysis of WBCs in the secondary recipient mice reconstituted with MLL-AF9-WT (MA9-WT) and MLL-AF9-Ythdc1 HET (MA9-HET) BM cells from the primary recipient mice; n = 5 mice for each group. (G) Wright-Giemsa–stained PB of the secondary MLL-AF9-WT (MA9-WT) and MLL-AF9-Ythdc1 HET (MA9-HET) mice. (H-I) Flow cytometric analysis of percentage of L-GMP (Lin−c-Kit+Sca1−CD34+FcR-ϒ+) in BM cells from the secondary recipient mice reconstituted with MLL-AF9-WT (MA9-WT) and MLL-AF9-Ythdc1 HET (MA9-HET) BM cells from the primary recipient mice. Gating strategy is shown in panel H. n = 6 mice for each group. (J) Flow cytometric analysis of percentage of cKit+Gr1– in BM cells of the secondary MLL-AF9-WT (MA9-WT) and MLL-AF9-Ythdc1 HET (MA9-HET) mice; n = 4 mice for each group. (K) Kaplan-Meier survival analysis of the secondary MLL-AF9-WT (MA9-WT) and MLL-AF9-Ythdc1 HET (MA9-HET) mice; n = 8 mice for the WT group, n = 10 mice for the HET group. Flow cytometric analysis of percentage of L-GMP (L) and cKit+Gr1– (M) in BM cells of the MLL-AF9-Ythdc1fl/fl ER Cre mice with or without TAM treatment; n = 4 mice for each group. Data are presented as mean ± standard deviation; Student t test or log-rank (Mantel-Cox) test for survival curve. *P < .05; **P < .01; ***P < .001.

