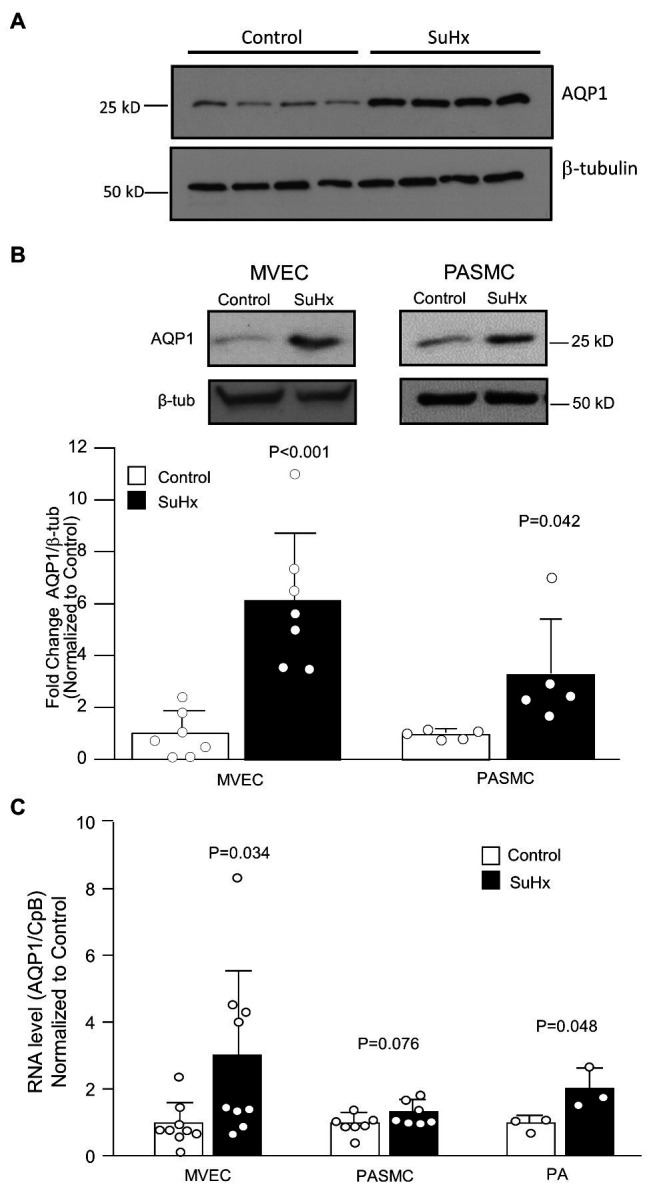
Figure 3.

Pulmonary vascular AQP1 expression. (A) Immunoblot image showing AQP1 protein levels in pulmonary arteries (PA) from control and SuHx rats. (B) Representative images and bar graphs (mean ± SD values) for AQP1 protein levels in microvascular endothelial cell (MVEC) and PASMCs isolated from control and SuHx rats. (C) Bar graphs (mean ± SD values) for mRNA levels of AQP1 relative to cyclophilin B (CpB; housekeeping) and normalized to values in Control rat samples. For all graphs, each dot represents samples from different animals and values of p determined by t-test.
